Honeywell 2008 Annual Report Download - page 33
Download and view the complete annual report
Please find page 33 of the 2008 Honeywell annual report below. You can navigate through the pages in the report by either clicking on the pages listed below, or by using the keyword search tool below to find specific information within the annual report.-
 1
1 -
2
-
3
-
4
-
5
-
6
-
7
-
8
-
9
-
10
-
11
-
12
-
13
-
14
-
15
-
16
-
17
-
18
-
19
-
20
-
21
-
22
-
 23
23 -
 24
24 -
 25
25 -
 26
26 -
 27
27 -
 28
28 -
 29
29 -
 30
30 -
 31
31 -
 32
32 -
 33
33 -
 34
34 -
 35
35 -
 36
36 -
 37
37 -
 38
38 -
 39
39 -
 40
40 -
 41
41 -
 42
42 -
 43
43 -
44
-
45
-
46
-
47
-
48
-
49
-
50
-
51
-
52
-
53
-
54
-
55
-
56
-
57
-
58
-
59
-
60
-
61
-
62
-
63
-
64
-
65
-
66
-
67
-
68
-
69
-
70
-
71
-
72
-
73
-
74
-
75
-
76
-
77
-
78
-
79
-
80
-
81
-
82
-
83
-
84
-
85
-
86
-
87
-
88
-
89
-
90
-
91
-
92
-
93
-
94
-
95
-
96
-
97
-
98
-
99
-
100
-
101
-
102
-
103
-
104
-
105
-
106
-
107
-
108
-
109
-
110
-
111
-
112
-
113
-
114
-
115
-
116
-
117
-
118
-
119
-
120
-
121
-
122
-
123
-
124
-
125
-
126
-
127
-
128
-
129
-
130
-
131
-
132
-
133
-
134
-
135
-
136
-
137
-
138
-
139
-
140
-
141
-
142
-
143
-
144
-
145
-
146
-
147
-
148
-
149
-
150
-
151
-
152
-
153
-
154
-
155
-
156
-
157
-
158
-
159
-
160
-
161
-
162
-
163
-
164
-
165
-
166
-
167
-
168
-
169
-
170
-
171
-
172
-
173
-
174
-
175
-
176
-
177
-
178
-
179
-
180
-
181
-
182
-
183
-
184
-
185
-
186
-
187
-
188
-
189
-
190
-
191
-
192
-
193
-
194
-
195
-
196
-
197
-
198
-
199
-
200
-
201
-
202
-
203
-
204
-
205
-
206
-
207
-
208
-
209
-
210
-
211
-
212
-
213
-
214
-
215
-
216
-
217
-
218
-
219
-
220
-
221
-
222
-
223
-
224
-
225
-
226
-
227
-
228
-
229
-
230
-
231
-
232
-
233
-
234
-
235
-
236
-
237
-
238
-
239
-
240
-
241
-
242
-
243
-
244
-
245
-
246
-
247
-
248
-
249
-
250
-
251
-
252
-
253
-
254
-
255
-
256
-
257
-
258
-
259
-
260
-
261
-
262
-
263
-
264
-
265
-
266
-
267
-
268
-
269
-
270
-
271
-
272
-
273
-
274
-
275
-
276
-
277
-
278
-
279
-
280
-
281
-
282
-
283
-
284
-
285
-
286
-
287
-
288
-
289
-
290
-
291
-
292
-
293
-
294
-
295
-
296
-
297
-
298
-
299
-
300
-
301
-
302
-
303
-
304
-
305
-
306
-
307
-
308
-
309
-
310
-
311
-
312
-
313
-
314
-
315
-
316
-
317
-
318
-
319
-
320
-
321
-
322
-
323
-
324
-
325
-
326
-
327
-
328
-
329
-
330
-
331
-
332
-
333
-
334
-
335
-
336
-
337
-
338
-
339
-
340
-
341
-
342
-
343
-
344
-
345
-
346
-
347
-
348
-
349
-
350
-
351
-
352
 |
 |

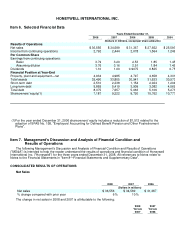
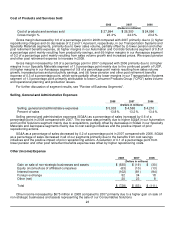
Cost of Products and Services Sold
2008 2007 2006
(Dollars in millions)
Cost of products and services sold $ 27,994 $ 26,300 $ 24,096
Gross margin % 23.4% 24.0% 23.2%
Gross margin decreased by 0.6 of a percentage point in 2008 compared with 2007 primarily due to (i) higher
repositioning charges and (ii) decreases of 2.2 and 1.4 percent, respectively, in our Transportation Systems and
Specialty Materials segments, primarily due to lower sales volume, partially offset by (i) lower pension and other
post retirement benefits expense, (ii) higher margins in our Automation and Controls Solutions segment of 0.8 of
a percentage point mainly resulting from productivity savings, and (iii) higher margins in our Aerospace segment
of 0.2 of a percentage point mainly resulting from sales volume growth and increased prices. We expect pension
and other post retirement expense to increase in 2009.
Gross margin increased by 0.8 of a percentage point in 2007 compared with 2006 primarily due to (i) higher
margins in our Specialty Materials segment of 1.0 percentage point mainly due to the continued growth of UOP,
(ii) higher margins in our Aerospace segment of 0.8 of a percentage point mainly resulting from sales volume
growth, increased prices and productivity savings, and (iii) lower pension and other post retirement benefits
expense of 0.3 of a percentage point, which were partially offset by lower margins in our Transportation Systems
segment of 1.0 percentage point primarily attributable to lower Consumer Products Group ("CPG") sales volume
and operational planning and production issues.
For further discussion of segment results, see "Review of Business Segments".
Selling, General and Administrative Expenses
2008 2007 2006
(Dollars in millions)
Selling, general and administrative expenses $ 5,033 $ 4,565 $ 4,210
Percent of sales 13.8% 13.2% 13.4%
Selling general and administrative expenses (SG&A) as a percentage of sales increased by 0.6 of a
percentage point in 2008 compared with 2007. The increase was primarily due to higher SG&A in our Automation
and Control Solutions segment mainly due to acquisitions, partially offset by decreases in SG&A in our Specialty
Materials and Aerospace segments mainly due to cost savings initiatives and the positive impact of prior
repositioning actions.
SG&A as a percentage of sales decreased by 0.2 of a percentage point in 2007 compared with 2006. SG&A
as a percentage of sales decreased in all of our segments primarily due to the benefits from cost savings
initiatives and the positive impact of prior repositioning actions. A reduction of 0.1 of a percentage point from
lower pension and other post retirement benefits expense was offset by higher repositioning costs.
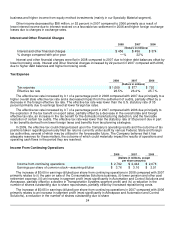
Other (Income)/Expense
2008 2007 2006
(Dollars in millions)
Gain on sale of non-strategic businesses and assets $ (635) $ (19) $ (30)
Equity (income)/loss of affiliated companies (63) (10) (13)
Interest income (102) (81) (94)
Foreign exchange 52 34 18
Other (net) 20 23 8
Total $ (728) $ (53) $ (111)
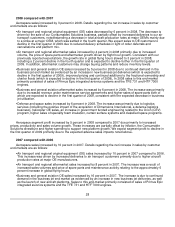
Other income increased by $675 million in 2008 compared to 2007 primarily due to a higher gain on sale of
non-strategic businesses and assets representing the sale of our Consumables Solutions
23