Honeywell 2003 Annual Report Download - page 421
Download and view the complete annual report
Please find page 421 of the 2003 Honeywell annual report below. You can navigate through the pages in the report by either clicking on the pages listed below, or by using the keyword search tool below to find specific information within the annual report.-
 1
1 -
2
-
3
-
4
-
5
-
6
-
7
-
8
-
9
-
10
-
11
-
12
-
13
-
14
-
15
-
16
-
17
-
18
-
19
-
20
-
21
-
22
-
23
-
24
-
25
-
26
-
27
-
28
-
29
-
30
-
31
-
32
-
33
-
34
-
35
-
36
-
37
-
38
-
39
-
40
-
41
-
42
-
43
-
44
-
45
-
46
-
47
-
48
-
49
-
50
-
51
-
52
-
53
-
54
-
55
-
56
-
57
-
58
-
59
-
60
-
61
-
62
-
63
-
64
-
65
-
66
-
67
-
68
-
69
-
70
-
71
-
72
-
73
-
74
-
75
-
76
-
77
-
78
-
79
-
80
-
81
-
82
-
83
-
84
-
85
-
86
-
87
-
88
-
89
-
90
-
91
-
92
-
93
-
94
-
95
-
96
-
97
-
98
-
99
-
100
-
101
-
102
-
103
-
104
-
105
-
106
-
107
-
108
-
109
-
110
-
111
-
112
-
113
-
114
-
115
-
116
-
117
-
118
-
119
-
120
-
121
-
122
-
123
-
124
-
125
-
126
-
127
-
128
-
129
-
130
-
131
-
132
-
133
-
134
-
135
-
136
-
137
-
138
-
139
-
140
-
141
-
142
-
143
-
144
-
145
-
146
-
147
-
148
-
149
-
150
-
151
-
152
-
153
-
154
-
155
-
156
-
157
-
158
-
159
-
160
-
161
-
162
-
163
-
164
-
165
-
166
-
167
-
168
-
169
-
170
-
171
-
172
-
173
-
174
-
175
-
176
-
177
-
178
-
179
-
180
-
181
-
182
-
183
-
184
-
185
-
186
-
187
-
188
-
189
-
190
-
191
-
192
-
193
-
194
-
195
-
196
-
197
-
198
-
199
-
200
-
201
-
202
-
203
-
204
-
205
-
206
-
207
-
208
-
209
-
210
-
211
-
212
-
213
-
214
-
215
-
216
-
217
-
218
-
219
-
220
-
221
-
222
-
223
-
224
-
225
-
226
-
227
-
228
-
229
-
230
-
231
-
232
-
233
-
234
-
235
-
236
-
237
-
238
-
239
-
240
-
241
-
242
-
243
-
244
-
245
-
246
-
247
-
248
-
249
-
250
-
251
-
252
-
253
-
254
-
255
-
256
-
257
-
258
-
259
-
260
-
261
-
262
-
263
-
264
-
265
-
266
-
267
-
268
-
269
-
270
-
271
-
272
-
273
-
274
-
275
-
276
-
277
-
278
-
279
-
280
-
281
-
282
-
283
-
284
-
285
-
286
-
287
-
288
-
289
-
290
-
291
-
292
-
293
-
294
-
295
-
296
-
297
-
298
-
299
-
300
-
301
-
302
-
303
-
304
-
305
-
306
-
307
-
308
-
309
-
310
-
311
-
312
-
313
-
314
-
315
-
316
-
317
-
318
-
319
-
320
-
321
-
322
-
323
-
324
-
325
-
326
-
327
-
328
-
329
-
330
-
331
-
332
-
333
-
334
-
335
-
336
-
337
-
338
-
339
-
340
-
341
-
342
-
343
-
344
-
345
-
346
-
347
-
348
-
349
-
350
-
351
-
352
-
353
-
354
-
355
-
356
-
357
-
358
-
359
-
360
-
361
-
362
-
363
-
364
-
365
-
366
-
367
-
368
-
369
-
370
-
371
-
372
-
373
-
374
-
375
-
376
-
377
-
378
-
379
-
380
-
381
-
382
-
383
-
384
-
385
-
386
-
387
-
388
-
389
-
390
-
391
-
392
-
393
-
394
-
395
-
396
-
397
-
398
-
399
-
400
-
401
-
402
-
403
-
404
-
405
-
406
-
407
-
408
-
409
-
410
-
 411
411 -
 412
412 -
 413
413 -
 414
414 -
 415
415 -
 416
416 -
 417
417 -
 418
418 -
 419
419 -
 420
420 -
 421
421 -
 422
422 -
 423
423 -
 424
424 -
 425
425 -
 426
426 -
 427
427 -
 428
428 -
 429
429 -
 430
430 -
 431
431 -
432
-
433
-
434
-
435
-
436
-
437
-
438
-
439
-
440
-
441
-
442
-
443
-
444
 |
 |
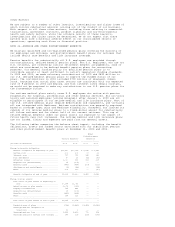
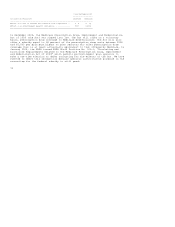
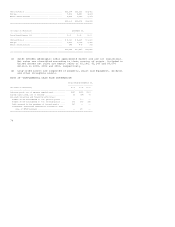
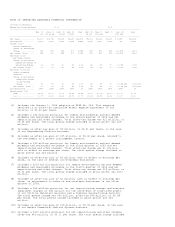
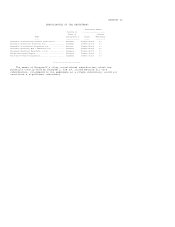
NOTE 26--UNAUDITED QUARTERLY FINANCIAL INFORMATION
(Dollars in Millions,
Except Per Share Amounts) 2003 2002
------------------------------------------------------------------------------------------------------------------------------
Mar. 31 June 30 Sept. 30 Dec. 31 Year Mar. 31 June 30 Sept. 30 Dec. 31 Year
(1) (2)(3)(4) (5)(6) (7)(8) (9)(10) (11)(12) (13)(14)
------------------------------------------------------------------------------------------------------------------------------
Net sales ............. $5,399 $5,749 $5,768 $6,187 $23,103 $5,199 $5,651 $5,569 $ 5,855 $22,274
Gross profit .......... 1,159 1,235 1,259 1,215 4,868 1,126 1,220 1,333 980 4,659
Income (loss)
before cumulative
effect of accounting
change ............. 274 319 344 407 1,344 376 459 412 (1,467) (220)
Net income (loss) ..... 254 319 344 407 1,324 376 459 412 (1,467) (220)
Earnings (loss)
per share--basic:
Income (loss) before
cumulative effect of
accounting change. .32 .37 .40 .47 1.56 .46 .56 .50 (1.78) (.27)
Net income (loss) .. .30 .37 .40 .47 1.54 .46 .56 .50 (1.78) (.27)
Earnings (loss) per
share--assuming
dilution:
Income (loss) before
cumulative effect
of accounting
change .......... .32 .37 .40 .47 1.56 .46 .56 .50 (1.78)(15) (.27)(15)
Net income (loss) .. .30 .37 .40 .47 1.54 .46 .56 .50 (1.78)(15) (.27)(15)
Dividends paid ........ .1875 .1875 .1875 .1875 .75 .1875 .1875 .1875 .1875 .75
Market price (16)
High ............... 25.65 29.02 30.06 33.43 33.43 40.37 40.76 36.50 27.08 40.76
Low ................ 20.73 21.61 26.22 26.56 20.73 29.11 34.85 21.66 19.20 19.20
==============================================================================================================================
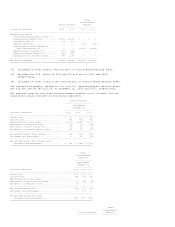
(1) Includes the January 1, 2003 adoption of SFAS No. 143. This adoption
resulted in an after-tax cumulative effect expense adjustment of $20
million, or $0.02 per share.
(2) Includes a $34 million provision for legacy environmental matters deemed
probable and reasonably estimable in the second quarter of 2003 and net
repositioning and other charges. Total after-tax charge was $21 million, or
$0.03 per share. The total pretax charge included in gross profit was $29
million.
(3) Includes an after-tax gain of $9 million, or $0.01 per share, on the sale
of our Engineering Plastics business.
(4) Includes an after-tax gain of $15 million, or $0.02 per share, related to
the settlement of a patent infringement lawsuit.
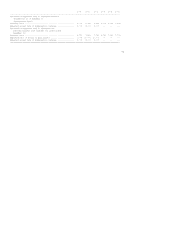
(5) Includes a $30 million provision for legacy environmental matters deemed
probable and reasonably estimable in the third quarter of 2003 and net
repositioning and other charges. Total after-tax charge was $1 million,
with no effect on earnings per share. The total pretax charge included in
gross profit was $26 million.
(6) Includes an after-tax loss of $3 million, with no effect on earnings per
share, on the sale of several non-strategic businesses.
(7) Includes a $214 million provision for legacy environmental matters deemed
probable and reasonably estimable in the fourth quarter of 2003 and net
repositioning and other charges. Total after-tax charge was $19 million, or
$0.02 per share. The total pretax charge included in gross profit was $217
million.
(8) Includes an after-tax loss of $2 million, with no effect on earnings per
share, on adjustments to sales of non-strategic businesses in the third
quarter of 2003.
(9) Includes a $53 million provision for net repositioning charges and business
impairment charges of $43 million for the write-down of long-lived assets
of our Friction Materials business and a chemical manufacturing facility.
The total pretax charge was $96 million, after-tax $69 million, or $0.08
per share. The total pretax charge included in gross profit was $46
million.
(10) Includes an after-tax gain of $79 million, or $0.09 per share, on the sale
of our Bendix Commercial Vehicle Systems business.
(11) Includes a $137 million provision for net repositioning and other charges,
after-tax $93 million, or $0.11 per share. The total pretax charge included