Honeywell 2003 Annual Report Download - page 419
Download and view the complete annual report
Please find page 419 of the 2003 Honeywell annual report below. You can navigate through the pages in the report by either clicking on the pages listed below, or by using the keyword search tool below to find specific information within the annual report.-
 1
1 -
2
-
3
-
4
-
5
-
6
-
7
-
8
-
9
-
10
-
11
-
12
-
13
-
14
-
15
-
16
-
17
-
18
-
19
-
20
-
21
-
22
-
23
-
24
-
25
-
26
-
27
-
28
-
29
-
30
-
31
-
32
-
33
-
34
-
35
-
36
-
37
-
38
-
39
-
40
-
41
-
42
-
43
-
44
-
45
-
46
-
47
-
48
-
49
-
50
-
51
-
52
-
53
-
54
-
55
-
56
-
57
-
58
-
59
-
60
-
61
-
62
-
63
-
64
-
65
-
66
-
67
-
68
-
69
-
70
-
71
-
72
-
73
-
74
-
75
-
76
-
77
-
78
-
79
-
80
-
81
-
82
-
83
-
84
-
85
-
86
-
87
-
88
-
89
-
90
-
91
-
92
-
93
-
94
-
95
-
96
-
97
-
98
-
99
-
100
-
101
-
102
-
103
-
104
-
105
-
106
-
107
-
108
-
109
-
110
-
111
-
112
-
113
-
114
-
115
-
116
-
117
-
118
-
119
-
120
-
121
-
122
-
123
-
124
-
125
-
126
-
127
-
128
-
129
-
130
-
131
-
132
-
133
-
134
-
135
-
136
-
137
-
138
-
139
-
140
-
141
-
142
-
143
-
144
-
145
-
146
-
147
-
148
-
149
-
150
-
151
-
152
-
153
-
154
-
155
-
156
-
157
-
158
-
159
-
160
-
161
-
162
-
163
-
164
-
165
-
166
-
167
-
168
-
169
-
170
-
171
-
172
-
173
-
174
-
175
-
176
-
177
-
178
-
179
-
180
-
181
-
182
-
183
-
184
-
185
-
186
-
187
-
188
-
189
-
190
-
191
-
192
-
193
-
194
-
195
-
196
-
197
-
198
-
199
-
200
-
201
-
202
-
203
-
204
-
205
-
206
-
207
-
208
-
209
-
210
-
211
-
212
-
213
-
214
-
215
-
216
-
217
-
218
-
219
-
220
-
221
-
222
-
223
-
224
-
225
-
226
-
227
-
228
-
229
-
230
-
231
-
232
-
233
-
234
-
235
-
236
-
237
-
238
-
239
-
240
-
241
-
242
-
243
-
244
-
245
-
246
-
247
-
248
-
249
-
250
-
251
-
252
-
253
-
254
-
255
-
256
-
257
-
258
-
259
-
260
-
261
-
262
-
263
-
264
-
265
-
266
-
267
-
268
-
269
-
270
-
271
-
272
-
273
-
274
-
275
-
276
-
277
-
278
-
279
-
280
-
281
-
282
-
283
-
284
-
285
-
286
-
287
-
288
-
289
-
290
-
291
-
292
-
293
-
294
-
295
-
296
-
297
-
298
-
299
-
300
-
301
-
302
-
303
-
304
-
305
-
306
-
307
-
308
-
309
-
310
-
311
-
312
-
313
-
314
-
315
-
316
-
317
-
318
-
319
-
320
-
321
-
322
-
323
-
324
-
325
-
326
-
327
-
328
-
329
-
330
-
331
-
332
-
333
-
334
-
335
-
336
-
337
-
338
-
339
-
340
-
341
-
342
-
343
-
344
-
345
-
346
-
347
-
348
-
349
-
350
-
351
-
352
-
353
-
354
-
355
-
356
-
357
-
358
-
359
-
360
-
361
-
362
-
363
-
364
-
365
-
366
-
367
-
368
-
369
-
370
-
371
-
372
-
373
-
374
-
375
-
376
-
377
-
378
-
379
-
380
-
381
-
382
-
383
-
384
-
385
-
386
-
387
-
388
-
389
-
390
-
391
-
392
-
393
-
394
-
395
-
396
-
397
-
398
-
399
-
400
-
401
-
402
-
403
-
404
-
405
-
406
-
407
-
408
-
 409
409 -
 410
410 -
 411
411 -
 412
412 -
 413
413 -
 414
414 -
 415
415 -
 416
416 -
 417
417 -
 418
418 -
 419
419 -
 420
420 -
 421
421 -
 422
422 -
 423
423 -
 424
424 -
 425
425 -
 426
426 -
 427
427 -
 428
428 -
 429
429 -
430
-
431
-
432
-
433
-
434
-
435
-
436
-
437
-
438
-
439
-
440
-
441
-
442
-
443
-
444
 |
 |
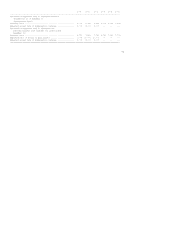
Years Ended December 31,
--------------------------
(Dollars in Millions) 2003 2002 2001
--------------------------------------------------------------------------------
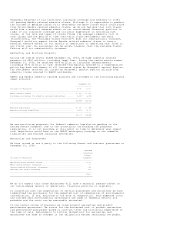
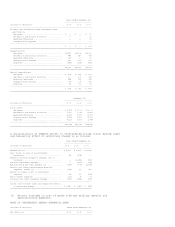
Goodwill and indefinite-lived intangible asset
amortization
Aerospace ..................................... $ -- $ -- $ 60
Automation and Control Solutions .............. -- -- 92
Specialty Materials ........................... -- -- 32
Transportation Systems ........................ -- -- 20
--------------------------------------------------------------------------------
$ -- $ -- $ 204
================================================================================
Segment profit
Aerospace ..................................... $1,221 $1,308 $1,599
Automation and Control Solutions .............. 843 860 774
Specialty Materials ........................... 136 90 56
Transportation Systems ........................ 461 393 307
Corporate ..................................... (142) (154) (153)
--------------------------------------------------------------------------------
$2,519 $2,497 $2,583
================================================================================
Capital expenditures
Aerospace ..................................... $ 218 $ 182 $ 212
Automation and Control Solutions .............. 100 106 154
Specialty Materials ........................... 144 233 325
Transportation Systems ........................ 108 108 172
Corporate ..................................... 85 42 13
--------------------------------------------------------------------------------
$ 655 $ 671 $ 876
================================================================================
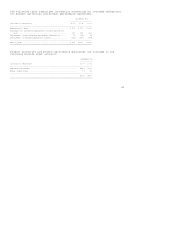
December 31,
---------------------------
(Dollars in Millions) 2003 2002 2001
--------------------------------------------------------------------------------
Total assets
Aerospace ..................................... $ 7,792 $ 7,006 $ 8,003
Automation and Control Solutions .............. 7,590 7,017 6,827
Specialty Materials ........................... 3,239 3,517 4,053
Transportation Systems ........................ 2,612 2,206 2,195
Corporate ..................................... 8,111 7,819 3,148
--------------------------------------------------------------------------------
$29,344 $27,565 $24,226
================================================================================
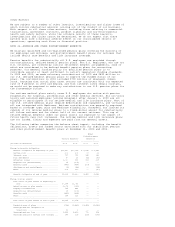
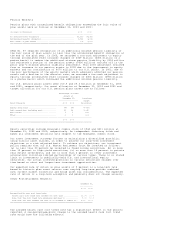
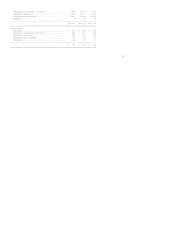
A reconciliation of segment profit to consolidated income (loss) before taxes
and cumulative effect of accounting change is as follows:
Years Ended December 31,
---------------------------
(Dollars in Millions) 2003 2002 2001
-------------------------------------------------------------------------------
Segment profit .................................. $ 2,519 $ 2,497 $ 2,583
Gain (loss) on sale of non-strategic
businesses ................................... 38 (124) --
Asbestos related litigation charges, net of
insurance .................................... -- (1,548) (159)
Business impairment charges ..................... -- (877) (145)
Repositioning and other charges (1) ............. (276) (606) (2,285)
Pension and other postretirement benefits
(expense) income (1) ........................ (325) 11 165
Equity in income (loss) of affiliated
companies .................................... 38 42 (193)
Other income (expense) .......................... (19) 4 17
Interest and other financial charges ............ (335) (344) (405)
-------------------------------------------------------------------------------
Income (loss) before taxes and cumulative effect
of accounting change ......................... $ 1,640 $ (945) $ (422)
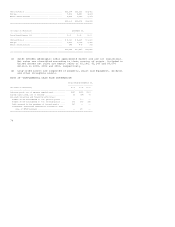
===============================================================================
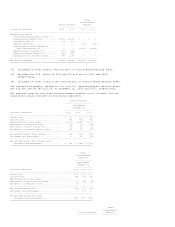
(1) Amounts included in cost of goods sold and selling, general and
administrative expenses.
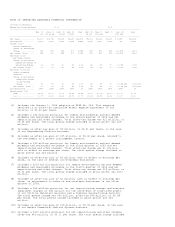
NOTE 24--GEOGRAPHIC AREAS--FINANCIAL DATA
(Dollars in Millions) Years Ended December 31,
--------------------------------------------------------------------------------
Net Sales (1) 2003 2002 2001
--------------------------------------------------------------------------------