Honeywell 2003 Annual Report Download - page 344
Download and view the complete annual report
Please find page 344 of the 2003 Honeywell annual report below. You can navigate through the pages in the report by either clicking on the pages listed below, or by using the keyword search tool below to find specific information within the annual report.-
 1
1 -
2
-
3
-
4
-
5
-
6
-
7
-
8
-
9
-
10
-
11
-
12
-
13
-
14
-
15
-
16
-
17
-
18
-
19
-
20
-
21
-
22
-
23
-
24
-
25
-
26
-
27
-
28
-
29
-
30
-
31
-
32
-
33
-
34
-
35
-
36
-
37
-
38
-
39
-
40
-
41
-
42
-
43
-
44
-
45
-
46
-
47
-
48
-
49
-
50
-
51
-
52
-
53
-
54
-
55
-
56
-
57
-
58
-
59
-
60
-
61
-
62
-
63
-
64
-
65
-
66
-
67
-
68
-
69
-
70
-
71
-
72
-
73
-
74
-
75
-
76
-
77
-
78
-
79
-
80
-
81
-
82
-
83
-
84
-
85
-
86
-
87
-
88
-
89
-
90
-
91
-
92
-
93
-
94
-
95
-
96
-
97
-
98
-
99
-
100
-
101
-
102
-
103
-
104
-
105
-
106
-
107
-
108
-
109
-
110
-
111
-
112
-
113
-
114
-
115
-
116
-
117
-
118
-
119
-
120
-
121
-
122
-
123
-
124
-
125
-
126
-
127
-
128
-
129
-
130
-
131
-
132
-
133
-
134
-
135
-
136
-
137
-
138
-
139
-
140
-
141
-
142
-
143
-
144
-
145
-
146
-
147
-
148
-
149
-
150
-
151
-
152
-
153
-
154
-
155
-
156
-
157
-
158
-
159
-
160
-
161
-
162
-
163
-
164
-
165
-
166
-
167
-
168
-
169
-
170
-
171
-
172
-
173
-
174
-
175
-
176
-
177
-
178
-
179
-
180
-
181
-
182
-
183
-
184
-
185
-
186
-
187
-
188
-
189
-
190
-
191
-
192
-
193
-
194
-
195
-
196
-
197
-
198
-
199
-
200
-
201
-
202
-
203
-
204
-
205
-
206
-
207
-
208
-
209
-
210
-
211
-
212
-
213
-
214
-
215
-
216
-
217
-
218
-
219
-
220
-
221
-
222
-
223
-
224
-
225
-
226
-
227
-
228
-
229
-
230
-
231
-
232
-
233
-
234
-
235
-
236
-
237
-
238
-
239
-
240
-
241
-
242
-
243
-
244
-
245
-
246
-
247
-
248
-
249
-
250
-
251
-
252
-
253
-
254
-
255
-
256
-
257
-
258
-
259
-
260
-
261
-
262
-
263
-
264
-
265
-
266
-
267
-
268
-
269
-
270
-
271
-
272
-
273
-
274
-
275
-
276
-
277
-
278
-
279
-
280
-
281
-
282
-
283
-
284
-
285
-
286
-
287
-
288
-
289
-
290
-
291
-
292
-
293
-
294
-
295
-
296
-
297
-
298
-
299
-
300
-
301
-
302
-
303
-
304
-
305
-
306
-
307
-
308
-
309
-
310
-
311
-
312
-
313
-
314
-
315
-
316
-
317
-
318
-
319
-
320
-
321
-
322
-
323
-
324
-
325
-
326
-
327
-
328
-
329
-
330
-
331
-
332
-
333
-
 334
334 -
 335
335 -
 336
336 -
 337
337 -
 338
338 -
 339
339 -
 340
340 -
 341
341 -
 342
342 -
 343
343 -
 344
344 -
 345
345 -
 346
346 -
 347
347 -
 348
348 -
 349
349 -
 350
350 -
 351
351 -
 352
352 -
 353
353 -
 354
354 -
355
-
356
-
357
-
358
-
359
-
360
-
361
-
362
-
363
-
364
-
365
-
366
-
367
-
368
-
369
-
370
-
371
-
372
-
373
-
374
-
375
-
376
-
377
-
378
-
379
-
380
-
381
-
382
-
383
-
384
-
385
-
386
-
387
-
388
-
389
-
390
-
391
-
392
-
393
-
394
-
395
-
396
-
397
-
398
-
399
-
400
-
401
-
402
-
403
-
404
-
405
-
406
-
407
-
408
-
409
-
410
-
411
-
412
-
413
-
414
-
415
-
416
-
417
-
418
-
419
-
420
-
421
-
422
-
423
-
424
-
425
-
426
-
427
-
428
-
429
-
430
-
431
-
432
-
433
-
434
-
435
-
436
-
437
-
438
-
439
-
440
-
441
-
442
-
443
-
444
 |
 |
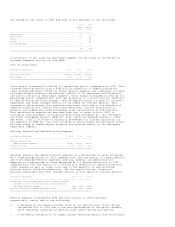
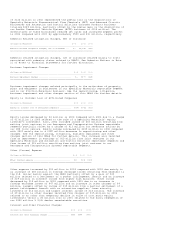
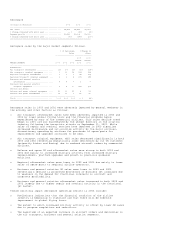
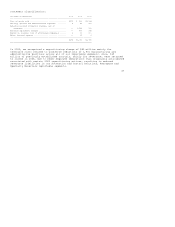
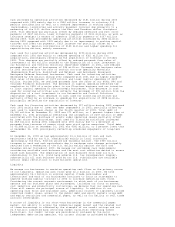
Aerospace
(Dollars in Millions) 2003 2002 2001
------------------------------------------------------------------------------
Net sales ....................................... $8,813 $8,855 $9,653
% change compared with prior year ............... -- % (8)% (3)%
Segment profit .................................. $1,221 $1,308 $1,599
% change compared with prior year ............... (7)% (18)% (20)%
==============================================================================
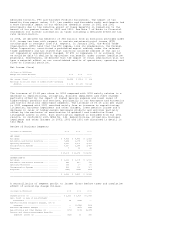
Aerospace sales by the major market segments follows:
% of Aerospace % Change in
Sales Sales
------------------ ----------------
2003 2002
Versus Versus
MARKET SEGMENT 2003 2002 2001 2002 2001
--------------------------------------------------------------------------------
Commercial:
Air transport aftermarket ............... 21% 20% 22% (1)% (13)%
Air transport original equipment ........ 9 11 14 (16) (28)
Regional transport aftermarket .......... 9 9 9 (8) (13)
Regional transport original equipment ... 2 2 4 (15) (45)
Business and general aviation
aftermarket .......................... 8 8 7 6 7
Business and general aviation
original equipment ................... 6 8 10 (21) (27)
Defense and Space:
Defense and space original equipment .... 32 31 25 4 13
Defense and space aftermarket ........... 13 11 9 16 12
---------------------------------------------------------------
Total ................................... 100% 100% 100% -- % (8)%
================================================================================
Aerospace sales in 2003 and 2002 were adversely impacted by general weakness in
the economy and other factors as follows:
o Air transport aftermarket sales have been adversely impacted in 2003 and
2002 by lower global flying hours and the financial problems being
experienced by many of the commercial airlines. This sales decline trend
began in 2001 and was exacerbated by the abrupt downturn in the aviation
industry following the terrorists attacks on September 11, 2001. While
sales of repair and overhaul services have improved in 2003 signaling
increased maintenance and out-sourcing activity by the major airlines,
discretionary spending by airlines for purchases of spare parts for
replacements and upgrades continues to be weak.
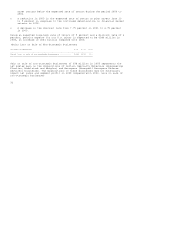
o Air transport original equipment (OE) sales decreased significantly in both
2003 and 2002 reflecting dramatically lower deliveries by our OE customers
(primarily Airbus and Boeing) due to reduced aircraft orders by commercial
airlines.
o Defense and space OE and aftermarket sales were strong in both 2003 and
2002 due mainly to increased military activity from increased military
replenishment, platform upgrades and growth in precision guidance
munitions.
o Regional aftermarket sales were lower in 2003 and 2002 due mainly to lower
sales of spare parts to regional airline operators.
o Business and general aviation OE sales were lower in 2003 and 2002
reflecting a decline in projected deliveries of business jet airplanes due
to weakness in the demand for fractional interests in aircraft and
corporate profitability.
o Business and general aviation aftermarket sales increased in both 2003 and
2002 largely due to higher repair and overhaul activity in the fractional
jet market.
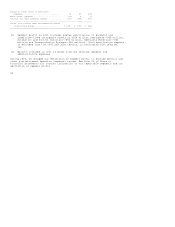
Trends which may impact Aerospace operating results in 2004 include:
o Preliminary indications that the financial condition of the airline
industry is beginning to stabilize and that there will be moderate
improvement in global flying hours.
o The extent to which increased military activity is offset by lower OE sales
due to program completions and reductions.
o The magnitude of an expected increase in aircraft orders and deliveries in
the air transport, business and general aviation segments.