Honeywell 2003 Annual Report Download - page 354
Download and view the complete annual report
Please find page 354 of the 2003 Honeywell annual report below. You can navigate through the pages in the report by either clicking on the pages listed below, or by using the keyword search tool below to find specific information within the annual report.-
 1
1 -
2
-
3
-
4
-
5
-
6
-
7
-
8
-
9
-
10
-
11
-
12
-
13
-
14
-
15
-
16
-
17
-
18
-
19
-
20
-
21
-
22
-
23
-
24
-
25
-
26
-
27
-
28
-
29
-
30
-
31
-
32
-
33
-
34
-
35
-
36
-
37
-
38
-
39
-
40
-
41
-
42
-
43
-
44
-
45
-
46
-
47
-
48
-
49
-
50
-
51
-
52
-
53
-
54
-
55
-
56
-
57
-
58
-
59
-
60
-
61
-
62
-
63
-
64
-
65
-
66
-
67
-
68
-
69
-
70
-
71
-
72
-
73
-
74
-
75
-
76
-
77
-
78
-
79
-
80
-
81
-
82
-
83
-
84
-
85
-
86
-
87
-
88
-
89
-
90
-
91
-
92
-
93
-
94
-
95
-
96
-
97
-
98
-
99
-
100
-
101
-
102
-
103
-
104
-
105
-
106
-
107
-
108
-
109
-
110
-
111
-
112
-
113
-
114
-
115
-
116
-
117
-
118
-
119
-
120
-
121
-
122
-
123
-
124
-
125
-
126
-
127
-
128
-
129
-
130
-
131
-
132
-
133
-
134
-
135
-
136
-
137
-
138
-
139
-
140
-
141
-
142
-
143
-
144
-
145
-
146
-
147
-
148
-
149
-
150
-
151
-
152
-
153
-
154
-
155
-
156
-
157
-
158
-
159
-
160
-
161
-
162
-
163
-
164
-
165
-
166
-
167
-
168
-
169
-
170
-
171
-
172
-
173
-
174
-
175
-
176
-
177
-
178
-
179
-
180
-
181
-
182
-
183
-
184
-
185
-
186
-
187
-
188
-
189
-
190
-
191
-
192
-
193
-
194
-
195
-
196
-
197
-
198
-
199
-
200
-
201
-
202
-
203
-
204
-
205
-
206
-
207
-
208
-
209
-
210
-
211
-
212
-
213
-
214
-
215
-
216
-
217
-
218
-
219
-
220
-
221
-
222
-
223
-
224
-
225
-
226
-
227
-
228
-
229
-
230
-
231
-
232
-
233
-
234
-
235
-
236
-
237
-
238
-
239
-
240
-
241
-
242
-
243
-
244
-
245
-
246
-
247
-
248
-
249
-
250
-
251
-
252
-
253
-
254
-
255
-
256
-
257
-
258
-
259
-
260
-
261
-
262
-
263
-
264
-
265
-
266
-
267
-
268
-
269
-
270
-
271
-
272
-
273
-
274
-
275
-
276
-
277
-
278
-
279
-
280
-
281
-
282
-
283
-
284
-
285
-
286
-
287
-
288
-
289
-
290
-
291
-
292
-
293
-
294
-
295
-
296
-
297
-
298
-
299
-
300
-
301
-
302
-
303
-
304
-
305
-
306
-
307
-
308
-
309
-
310
-
311
-
312
-
313
-
314
-
315
-
316
-
317
-
318
-
319
-
320
-
321
-
322
-
323
-
324
-
325
-
326
-
327
-
328
-
329
-
330
-
331
-
332
-
333
-
334
-
335
-
336
-
337
-
338
-
339
-
340
-
341
-
342
-
343
-
 344
344 -
 345
345 -
 346
346 -
 347
347 -
 348
348 -
 349
349 -
 350
350 -
 351
351 -
 352
352 -
 353
353 -
 354
354 -
 355
355 -
 356
356 -
 357
357 -
 358
358 -
 359
359 -
 360
360 -
 361
361 -
 362
362 -
 363
363 -
 364
364 -
365
-
366
-
367
-
368
-
369
-
370
-
371
-
372
-
373
-
374
-
375
-
376
-
377
-
378
-
379
-
380
-
381
-
382
-
383
-
384
-
385
-
386
-
387
-
388
-
389
-
390
-
391
-
392
-
393
-
394
-
395
-
396
-
397
-
398
-
399
-
400
-
401
-
402
-
403
-
404
-
405
-
406
-
407
-
408
-
409
-
410
-
411
-
412
-
413
-
414
-
415
-
416
-
417
-
418
-
419
-
420
-
421
-
422
-
423
-
424
-
425
-
426
-
427
-
428
-
429
-
430
-
431
-
432
-
433
-
434
-
435
-
436
-
437
-
438
-
439
-
440
-
441
-
442
-
443
-
444
 |
 |
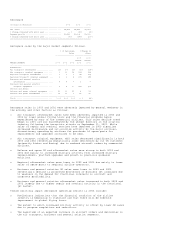
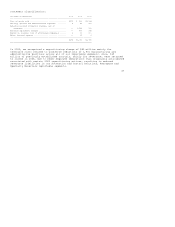
Cash provided by operating activities decreased by $181 million during 2003
compared with 2002 mainly due to a $540 million increase in voluntary U.S.
pension contributions as well as a reduced improvement in working capital
(receivables, inventories and accounts payable) turnover due primarily to a
weakening of the U.S. dollar versus the Euro and Canadian dollar throughout
2003. This decrease was partially offset by reduced severance and exit costs
payments of $247 million, lower litigation payments of $222 million, as well as
insurance receipts in excess of asbestos liability payments of $107 million
during 2003. Cash provided by operating activities increased by $384 million
during 2002 compared with 2001 mainly due to an improvement in working capital
turnover and lower tax payments. This increase was partially offset by a
voluntary U.S. pension contribution of $130 million and higher spending for
repositioning actions, mainly severance.
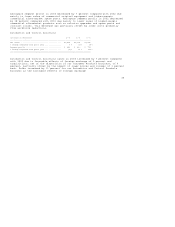
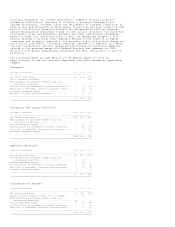
Cash used for investing activities decreased by $190 million during 2003
compared with 2002 due mainly to reduced spending of $321 million for
acquisitions, principally reflecting the acquisition of Invensys in October
2002. This decrease was partially offset by reduced proceeds from sales of
investments of $91 million related to the disposition of a cost investment in
our Automation and Controls Solutions reportable segment in 2002, and reduced
proceeds from sales of businesses of $46 million. Proceeds from business sales
in 2003 resulted from the sale of certain non-core Specialty Materials
(Engineering Plastics, Rudolstadt and Metglas) and Aerospace (Honeywell
Aerospace Defense Services) businesses. Cash used for investing activities
decreased by $36 million during 2002 compared with 2001 due to higher proceeds
from sales of businesses of $139 million and lower capital spending of $205
million. During 2002, we realized proceeds from the sales of our BCVS, PFC and
Consumer Products businesses. The decrease in capital spending reflected the
completion in 2002 of a major plant in our Fluorines business and our intention
to limit capital spending at non-strategic businesses. This decrease in cash
used for investing activities also reflects the proceeds of $91 million from the
disposition of a cost investment in our Automation and Control Solutions
reportable segment. This decrease in cash used for investing activities was
partially offset by an increase in spending for acquisitions of $398 million,
principally reflecting the acquisition of Invensys.
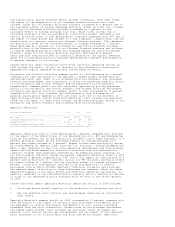
Cash used for financing activities decreased by $37 million during 2003 compared
with 2002 mainly due to lower net debt repayments in 2003, partially offset by
cash used to repurchase shares in the fourth quarter of 2003. Total debt of
$5,160 million at December 31, 2003 was $71 million, or 1 percent higher than at
December 31, 2002 principally reflecting the assumption of $267 million of debt
associated with the purchase of assets under operating leases partially offset
by lower short-term borrowings. Cash used for financing activities increased
by $48 million during 2002 compared with 2001 mainly due to a decrease in
proceeds from issuance of common stock upon stock option exercises. Total debt
of $5,089 million at December 31, 2002 was $181 million, or 3 percent lower than
at December 31, 2001 principally reflecting scheduled repayments of long-term
debt.
At December 31, 2003 we had approximately $2.6 billion of cash and cash
equivalents held by non U.S. subsidiaries mainly in local currencies
(principally the Euro, British pound and Canadian dollar). The $305 million
increase in cash and cash equivalents due to exchange rate changes principally
resulted from a weakening of the U.S. dollar mainly against the Euro and
Canadian dollar throughout 2003. We manage our worldwide cash requirements
considering available cash balances and the most cost effective method to access
those cash balances. The repatriation of cash balances from some non U.S.
subsidiaries to the U.S. could have adverse U.S. tax consequences; however,
substantially all cash balances held by non U.S. subsidiaries are available
without legal restrictions to fund business operations.
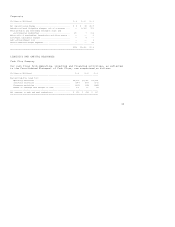
Liquidity
We manage our businesses to maximize operating cash flows as the primary source
of our liquidity. Operating cash flows were $2.2 billion in 2003. We have
approximately $6.2 billion in working capital (trade receivables and
inventories) and each of our businesses continues to focus on strategies to
improve working capital turnover in 2004 to increase operating cash flows.
Considering the current economic environment in which each of our businesses
operate and our business plans and strategies, including our focus on growth,
cost reduction and productivity initiatives, we believe that our operating cash
flows will remain our principal source of liquidity. In addition to our
operating cash flows and available cash, additional sources of liquidity include
committed credit lines, access to the public debt and equity markets using debt
and equity securities and commercial paper, as well as our ability to sell trade
accounts receivables.
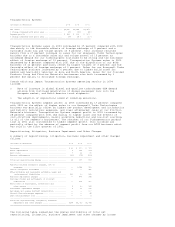
A source of liquidity is our short-term borrowings in the commercial paper
market. Our ability to access the commercial paper market and the related cost
of these borrowings is affected by the strength of our credit ratings and our
$2.3 billion committed bank revolving credit facilities (Revolving Credit
Facilities). Our credit ratings are periodically reviewed by the major
independent debt-rating agencies. Our current ratings as provided by Moody's