Honeywell 2003 Annual Report Download - page 330
Download and view the complete annual report
Please find page 330 of the 2003 Honeywell annual report below. You can navigate through the pages in the report by either clicking on the pages listed below, or by using the keyword search tool below to find specific information within the annual report.-
 1
1 -
2
-
3
-
4
-
5
-
6
-
7
-
8
-
9
-
10
-
11
-
12
-
13
-
14
-
15
-
16
-
17
-
18
-
19
-
20
-
21
-
22
-
23
-
24
-
25
-
26
-
27
-
28
-
29
-
30
-
31
-
32
-
33
-
34
-
35
-
36
-
37
-
38
-
39
-
40
-
41
-
42
-
43
-
44
-
45
-
46
-
47
-
48
-
49
-
50
-
51
-
52
-
53
-
54
-
55
-
56
-
57
-
58
-
59
-
60
-
61
-
62
-
63
-
64
-
65
-
66
-
67
-
68
-
69
-
70
-
71
-
72
-
73
-
74
-
75
-
76
-
77
-
78
-
79
-
80
-
81
-
82
-
83
-
84
-
85
-
86
-
87
-
88
-
89
-
90
-
91
-
92
-
93
-
94
-
95
-
96
-
97
-
98
-
99
-
100
-
101
-
102
-
103
-
104
-
105
-
106
-
107
-
108
-
109
-
110
-
111
-
112
-
113
-
114
-
115
-
116
-
117
-
118
-
119
-
120
-
121
-
122
-
123
-
124
-
125
-
126
-
127
-
128
-
129
-
130
-
131
-
132
-
133
-
134
-
135
-
136
-
137
-
138
-
139
-
140
-
141
-
142
-
143
-
144
-
145
-
146
-
147
-
148
-
149
-
150
-
151
-
152
-
153
-
154
-
155
-
156
-
157
-
158
-
159
-
160
-
161
-
162
-
163
-
164
-
165
-
166
-
167
-
168
-
169
-
170
-
171
-
172
-
173
-
174
-
175
-
176
-
177
-
178
-
179
-
180
-
181
-
182
-
183
-
184
-
185
-
186
-
187
-
188
-
189
-
190
-
191
-
192
-
193
-
194
-
195
-
196
-
197
-
198
-
199
-
200
-
201
-
202
-
203
-
204
-
205
-
206
-
207
-
208
-
209
-
210
-
211
-
212
-
213
-
214
-
215
-
216
-
217
-
218
-
219
-
220
-
221
-
222
-
223
-
224
-
225
-
226
-
227
-
228
-
229
-
230
-
231
-
232
-
233
-
234
-
235
-
236
-
237
-
238
-
239
-
240
-
241
-
242
-
243
-
244
-
245
-
246
-
247
-
248
-
249
-
250
-
251
-
252
-
253
-
254
-
255
-
256
-
257
-
258
-
259
-
260
-
261
-
262
-
263
-
264
-
265
-
266
-
267
-
268
-
269
-
270
-
271
-
272
-
273
-
274
-
275
-
276
-
277
-
278
-
279
-
280
-
281
-
282
-
283
-
284
-
285
-
286
-
287
-
288
-
289
-
290
-
291
-
292
-
293
-
294
-
295
-
296
-
297
-
298
-
299
-
300
-
301
-
302
-
303
-
304
-
305
-
306
-
307
-
308
-
309
-
310
-
311
-
312
-
313
-
314
-
315
-
316
-
317
-
318
-
319
-
 320
320 -
 321
321 -
 322
322 -
 323
323 -
 324
324 -
 325
325 -
 326
326 -
 327
327 -
 328
328 -
 329
329 -
 330
330 -
 331
331 -
 332
332 -
 333
333 -
 334
334 -
 335
335 -
 336
336 -
 337
337 -
 338
338 -
 339
339 -
 340
340 -
341
-
342
-
343
-
344
-
345
-
346
-
347
-
348
-
349
-
350
-
351
-
352
-
353
-
354
-
355
-
356
-
357
-
358
-
359
-
360
-
361
-
362
-
363
-
364
-
365
-
366
-
367
-
368
-
369
-
370
-
371
-
372
-
373
-
374
-
375
-
376
-
377
-
378
-
379
-
380
-
381
-
382
-
383
-
384
-
385
-
386
-
387
-
388
-
389
-
390
-
391
-
392
-
393
-
394
-
395
-
396
-
397
-
398
-
399
-
400
-
401
-
402
-
403
-
404
-
405
-
406
-
407
-
408
-
409
-
410
-
411
-
412
-
413
-
414
-
415
-
416
-
417
-
418
-
419
-
420
-
421
-
422
-
423
-
424
-
425
-
426
-
427
-
428
-
429
-
430
-
431
-
432
-
433
-
434
-
435
-
436
-
437
-
438
-
439
-
440
-
441
-
442
-
443
-
444
 |
 |
measuring pressure, air flow, temperature, electrical current and, security and
fire detection, access control and video surveillance systems); Building
Solutions (installs, maintains and upgrades systems that keep buildings safe,
comfortable and productive); and Process Solutions (provides a full range of
automation and control solutions for industrial plants, offering advanced
software and automation systems that integrate, control and monitor complex
processes in many types of industrial settings).
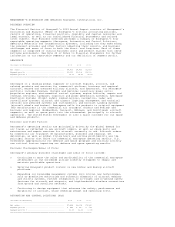
Economic and Other Factors
ACS' operating results are principally driven by global residential and
nonresidential construction, industrial production, capital spending on process
and building automation, and security concerns and regulations.
Business Challenges/Areas of Focus
ACS' primary business challenges and areas of focus include:
o Extending technology leadership: lowest total installed cost, integrated
solutions within our security, fire and sensors product portfolios.
o Defending and extending our installed base through customer productivity
and globalization.
o Sustaining strong brand recognition.
o Investing in sales and marketing resources and capabilities.
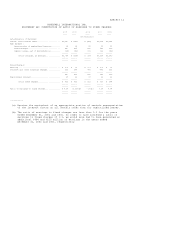
SPECIALTY MATERIALS
(Dollars in Millions) 2003 2002 2001
-------------------------------------------------------------------------------
Net sales .......................................... $3,169 $3,205 $3,313
Segment profit ..................................... $ 136 $ 90 $ 56
Segment profit % ................................... 4.3% 2.8% 1.7%
===============================================================================
Specialty Materials provides high-performance specialty materials for
applications in the electronics, packaging, fibers, refrigeration, wax and
adhesives markets. Specialty Materials' product portfolio includes fibers,
specialty films, intermediate chemicals, flourine-based products, pharmaceutical
and agricultural chemicals, specialty waxes, adhesives and sealants, process
technology, and wafer fabrication materials and services. Core growth businesses
include Fluorines, Electronic Materials, Advanced Fibers and Composites,
Specialty Films and Research and Life Sciences.
Economic and Other Factors
Specialty Materials' operating results are principally driven by global gross
domestic product, plant capacity utilization and the costs of raw materials
including natural gas and benzene. Although we expect raw material costs to
remain at historically high levels in 2004, based on current volume usage, a 10
percent increase in the year-end price of natural gas and benzene would increase
our costs by $12 and $15 million, respectively.
Business Challenges/Areas of Focus
Specialty Materials' primary business challenges and areas of focus include:
o Sharpening the focus on core growth platforms to drive new product
introduction and improved profitability.
o Continuing to restructure and exit non-core commodity lines of business
with minimal or no differentiating technology.
o Continuing to improve manufacturing productivity.
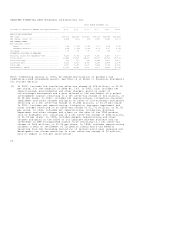
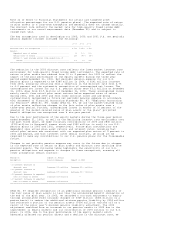
TRANSPORTATION SYSTEMS
(Dollars in Millions) 2003 2002 2001
--------------------------------------------------------------------------------
Net sales ........................................... $3,650 $3,184 $3,457
Segment profit ...................................... $ 461 $ 393 $ 307
Segment profit % .................................... 12.6% 12.3% 8.9%
================================================================================
Transportation Systems provides automotive products that improve the
performance, efficiency, and appearance of cars, trucks, and other vehicles
through state-of-the-art technologies, world class brands and global solutions
to our customers needs. Our Transportation Systems' portfolio includes Honeywell
Turbo Technologies (Garrett(R) turbochargers and charge-air and thermal