Honeywell 2003 Annual Report Download - page 346
Download and view the complete annual report
Please find page 346 of the 2003 Honeywell annual report below. You can navigate through the pages in the report by either clicking on the pages listed below, or by using the keyword search tool below to find specific information within the annual report.-
 1
1 -
2
-
3
-
4
-
5
-
6
-
7
-
8
-
9
-
10
-
11
-
12
-
13
-
14
-
15
-
16
-
17
-
18
-
19
-
20
-
21
-
22
-
23
-
24
-
25
-
26
-
27
-
28
-
29
-
30
-
31
-
32
-
33
-
34
-
35
-
36
-
37
-
38
-
39
-
40
-
41
-
42
-
43
-
44
-
45
-
46
-
47
-
48
-
49
-
50
-
51
-
52
-
53
-
54
-
55
-
56
-
57
-
58
-
59
-
60
-
61
-
62
-
63
-
64
-
65
-
66
-
67
-
68
-
69
-
70
-
71
-
72
-
73
-
74
-
75
-
76
-
77
-
78
-
79
-
80
-
81
-
82
-
83
-
84
-
85
-
86
-
87
-
88
-
89
-
90
-
91
-
92
-
93
-
94
-
95
-
96
-
97
-
98
-
99
-
100
-
101
-
102
-
103
-
104
-
105
-
106
-
107
-
108
-
109
-
110
-
111
-
112
-
113
-
114
-
115
-
116
-
117
-
118
-
119
-
120
-
121
-
122
-
123
-
124
-
125
-
126
-
127
-
128
-
129
-
130
-
131
-
132
-
133
-
134
-
135
-
136
-
137
-
138
-
139
-
140
-
141
-
142
-
143
-
144
-
145
-
146
-
147
-
148
-
149
-
150
-
151
-
152
-
153
-
154
-
155
-
156
-
157
-
158
-
159
-
160
-
161
-
162
-
163
-
164
-
165
-
166
-
167
-
168
-
169
-
170
-
171
-
172
-
173
-
174
-
175
-
176
-
177
-
178
-
179
-
180
-
181
-
182
-
183
-
184
-
185
-
186
-
187
-
188
-
189
-
190
-
191
-
192
-
193
-
194
-
195
-
196
-
197
-
198
-
199
-
200
-
201
-
202
-
203
-
204
-
205
-
206
-
207
-
208
-
209
-
210
-
211
-
212
-
213
-
214
-
215
-
216
-
217
-
218
-
219
-
220
-
221
-
222
-
223
-
224
-
225
-
226
-
227
-
228
-
229
-
230
-
231
-
232
-
233
-
234
-
235
-
236
-
237
-
238
-
239
-
240
-
241
-
242
-
243
-
244
-
245
-
246
-
247
-
248
-
249
-
250
-
251
-
252
-
253
-
254
-
255
-
256
-
257
-
258
-
259
-
260
-
261
-
262
-
263
-
264
-
265
-
266
-
267
-
268
-
269
-
270
-
271
-
272
-
273
-
274
-
275
-
276
-
277
-
278
-
279
-
280
-
281
-
282
-
283
-
284
-
285
-
286
-
287
-
288
-
289
-
290
-
291
-
292
-
293
-
294
-
295
-
296
-
297
-
298
-
299
-
300
-
301
-
302
-
303
-
304
-
305
-
306
-
307
-
308
-
309
-
310
-
311
-
312
-
313
-
314
-
315
-
316
-
317
-
318
-
319
-
320
-
321
-
322
-
323
-
324
-
325
-
326
-
327
-
328
-
329
-
330
-
331
-
332
-
333
-
334
-
335
-
 336
336 -
 337
337 -
 338
338 -
 339
339 -
 340
340 -
 341
341 -
 342
342 -
 343
343 -
 344
344 -
 345
345 -
 346
346 -
 347
347 -
 348
348 -
 349
349 -
 350
350 -
 351
351 -
 352
352 -
 353
353 -
 354
354 -
 355
355 -
 356
356 -
357
-
358
-
359
-
360
-
361
-
362
-
363
-
364
-
365
-
366
-
367
-
368
-
369
-
370
-
371
-
372
-
373
-
374
-
375
-
376
-
377
-
378
-
379
-
380
-
381
-
382
-
383
-
384
-
385
-
386
-
387
-
388
-
389
-
390
-
391
-
392
-
393
-
394
-
395
-
396
-
397
-
398
-
399
-
400
-
401
-
402
-
403
-
404
-
405
-
406
-
407
-
408
-
409
-
410
-
411
-
412
-
413
-
414
-
415
-
416
-
417
-
418
-
419
-
420
-
421
-
422
-
423
-
424
-
425
-
426
-
427
-
428
-
429
-
430
-
431
-
432
-
433
-
434
-
435
-
436
-
437
-
438
-
439
-
440
-
441
-
442
-
443
-
444
 |
 |
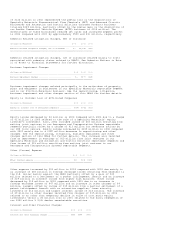
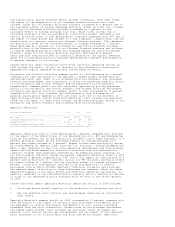
and acquisitions, mainly Invensys Sensor Systems (Invensys), more than offset
the impact of the disposition of our Consumer Products business and lower
volumes. Sales for our Process Solutions business increased by 4 percent due to
the favorable effect of foreign exchange partially offset by lower unit volumes.
Sales for our Building Solutions business increased by 2 percent as the
favorable effect of foreign exchange more than offset lower volumes due to
continued softness in the non-residential construction market. Automation and
Control Solutions sales in 2002 decreased by 3 percent compared with 2001 due to
the impact of lower prices and volumes of 2 and 1 percent, respectively, and net
divestitures of 1 percent, mainly our Consumer Products business. This decrease
was partially offset by the favorable effect of foreign exchange of 1 percent.
Sales declined by 2 percent for our Automation and Control Products business
primarily due to the disposition of our Consumer Products business and softness
in capital spending partially offset by increased demand for security-related
products. Sales for our Process Solutions business declined by 4 percent
resulting from ongoing softness in industrial production and capital spending.
Sales for our Building Solutions business decreased by 3 percent due primarily
to general weakness in the economy.
Trends which may impact Automation and Control Solutions operating results in
2004 include the extent, if any, of recovery in non-residential construction
spending and capital spending on process and building automation.
Automation and Controls Solutions segment profit in 2003 decreased by 2 percent
compared with 2002 due mainly to the decline in higher-margin energy-retrofit
and discretionary spot sales in our Building Solutions business, and increased
research and development and investments in sales and marketing capacity, mainly
in our Automation and Control Products and Building Solutions businesses,
respectively. Segment profit was also adversely impacted by pricing pressures
mainly in our Automation and Control Products and Process Solutions businesses.
Automation and Control Solutions segment profit in 2002 increased by 11 percent
compared with 2001. This increase resulted primarily from the absence of
goodwill amortization expense in 2002 and lower costs due to the benefits of
repositioning actions, mainly workforce reductions. This increase was partially
offset by the impact of lower sales volumes and pricing pressures, mainly in our
Automation and Control Products and Building Solutions businesses.
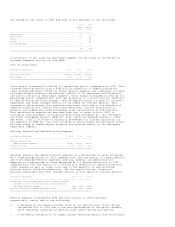
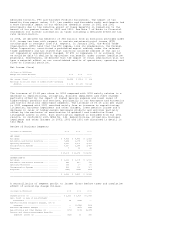
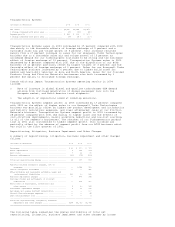
Specialty Materials
(Dollars in Millions) 2003 2002 2001
------------------------------------------------------------------------------
Net sales ....................................... $3,169 $3,205 $3,313
% change compared with prior year ............... (1)% (3)% (18)%
Segment profit .................................. $ 136 $ 90 $ 56
% change compared with prior year ............... 51 % 61 % (83)%
==============================================================================
Specialty Materials sales in 2003 decreased by 1 percent compared with 2002 due
to the impact of the divestitures of our Advanced Circuits, PFC and Engineering
Plastics businesses, net of the acquisition of BASF's nylon fiber business, of 6
percent partially offset by the favorable effects of foreign exchange of 3
percent and higher volumes of 2 percent. Higher volumes were principally driven
by strong demand for Spectra fiber from the U.S. military, increasing demand for
HFCs, a key component of many non-ozone depleting refrigerants and foam blowing
agents and increased demand for electronic materials from the semiconductor
industry. Volumes were adversely affected by the temporary plant shutdowns in
our Fluorocarbons and Nylon System businesses. Specialty Materials sales in 2002
decreased by 3 percent compared with 2001 due to the impact of lower prices of 5
percent and divestitures of 1 percent, mainly our PFC business, partially offset
by higher volumes of 2 percent and the favorable effect of foreign exchange of 1
percent. Industrial overcapacity resulted in pricing pressures in several
businesses such as Nylon System, Specialty Chemicals, Polyester and Flourines.
The adverse impact of pricing in these businesses was somewhat offset by higher
demand principally in our Nylon System and Electronic Materials businesses. In
addition, weakness in the telecommunication industry drove a substantial decline
in sales in our Advanced Circuits business which we sold in the fourth quarter
of 2002.
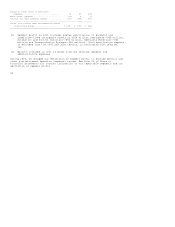
Trends which may impact Specialty Materials operating results in 2004 include:
o Continued excess global capacity in the production of polyester and nylon.
o Key raw material costs (natural gas and benzene) remaining at historically
high levels.
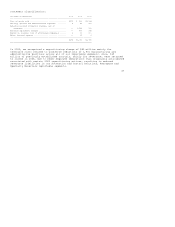
Specialty Materials segment profit in 2003 increased by 51 percent compared with
2002 due mainly to the impact of the prior year write-down of property, plant
and equipment in several businesses, the benefits of cost actions including
synergies from the nylon transaction, divestitures of non-strategic businesses
and higher sales volumes. This increase was partially offset by higher raw
material costs (mainly natural gas and benzene) and the impact of the temporary
plant shutdowns in our Fluorocarbons and Nylon System businesses. Specialty