Honeywell 2003 Annual Report Download - page 340
Download and view the complete annual report
Please find page 340 of the 2003 Honeywell annual report below. You can navigate through the pages in the report by either clicking on the pages listed below, or by using the keyword search tool below to find specific information within the annual report.-
 1
1 -
2
-
3
-
4
-
5
-
6
-
7
-
8
-
9
-
10
-
11
-
12
-
13
-
14
-
15
-
16
-
17
-
18
-
19
-
20
-
21
-
22
-
23
-
24
-
25
-
26
-
27
-
28
-
29
-
30
-
31
-
32
-
33
-
34
-
35
-
36
-
37
-
38
-
39
-
40
-
41
-
42
-
43
-
44
-
45
-
46
-
47
-
48
-
49
-
50
-
51
-
52
-
53
-
54
-
55
-
56
-
57
-
58
-
59
-
60
-
61
-
62
-
63
-
64
-
65
-
66
-
67
-
68
-
69
-
70
-
71
-
72
-
73
-
74
-
75
-
76
-
77
-
78
-
79
-
80
-
81
-
82
-
83
-
84
-
85
-
86
-
87
-
88
-
89
-
90
-
91
-
92
-
93
-
94
-
95
-
96
-
97
-
98
-
99
-
100
-
101
-
102
-
103
-
104
-
105
-
106
-
107
-
108
-
109
-
110
-
111
-
112
-
113
-
114
-
115
-
116
-
117
-
118
-
119
-
120
-
121
-
122
-
123
-
124
-
125
-
126
-
127
-
128
-
129
-
130
-
131
-
132
-
133
-
134
-
135
-
136
-
137
-
138
-
139
-
140
-
141
-
142
-
143
-
144
-
145
-
146
-
147
-
148
-
149
-
150
-
151
-
152
-
153
-
154
-
155
-
156
-
157
-
158
-
159
-
160
-
161
-
162
-
163
-
164
-
165
-
166
-
167
-
168
-
169
-
170
-
171
-
172
-
173
-
174
-
175
-
176
-
177
-
178
-
179
-
180
-
181
-
182
-
183
-
184
-
185
-
186
-
187
-
188
-
189
-
190
-
191
-
192
-
193
-
194
-
195
-
196
-
197
-
198
-
199
-
200
-
201
-
202
-
203
-
204
-
205
-
206
-
207
-
208
-
209
-
210
-
211
-
212
-
213
-
214
-
215
-
216
-
217
-
218
-
219
-
220
-
221
-
222
-
223
-
224
-
225
-
226
-
227
-
228
-
229
-
230
-
231
-
232
-
233
-
234
-
235
-
236
-
237
-
238
-
239
-
240
-
241
-
242
-
243
-
244
-
245
-
246
-
247
-
248
-
249
-
250
-
251
-
252
-
253
-
254
-
255
-
256
-
257
-
258
-
259
-
260
-
261
-
262
-
263
-
264
-
265
-
266
-
267
-
268
-
269
-
270
-
271
-
272
-
273
-
274
-
275
-
276
-
277
-
278
-
279
-
280
-
281
-
282
-
283
-
284
-
285
-
286
-
287
-
288
-
289
-
290
-
291
-
292
-
293
-
294
-
295
-
296
-
297
-
298
-
299
-
300
-
301
-
302
-
303
-
304
-
305
-
306
-
307
-
308
-
309
-
310
-
311
-
312
-
313
-
314
-
315
-
316
-
317
-
318
-
319
-
320
-
321
-
322
-
323
-
324
-
325
-
326
-
327
-
328
-
329
-
 330
330 -
 331
331 -
 332
332 -
 333
333 -
 334
334 -
 335
335 -
 336
336 -
 337
337 -
 338
338 -
 339
339 -
 340
340 -
 341
341 -
 342
342 -
 343
343 -
 344
344 -
 345
345 -
 346
346 -
 347
347 -
 348
348 -
 349
349 -
 350
350 -
351
-
352
-
353
-
354
-
355
-
356
-
357
-
358
-
359
-
360
-
361
-
362
-
363
-
364
-
365
-
366
-
367
-
368
-
369
-
370
-
371
-
372
-
373
-
374
-
375
-
376
-
377
-
378
-
379
-
380
-
381
-
382
-
383
-
384
-
385
-
386
-
387
-
388
-
389
-
390
-
391
-
392
-
393
-
394
-
395
-
396
-
397
-
398
-
399
-
400
-
401
-
402
-
403
-
404
-
405
-
406
-
407
-
408
-
409
-
410
-
411
-
412
-
413
-
414
-
415
-
416
-
417
-
418
-
419
-
420
-
421
-
422
-
423
-
424
-
425
-
426
-
427
-
428
-
429
-
430
-
431
-
432
-
433
-
434
-
435
-
436
-
437
-
438
-
439
-
440
-
441
-
442
-
443
-
444
 |
 |
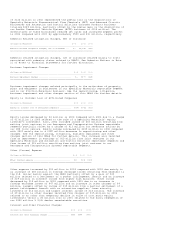
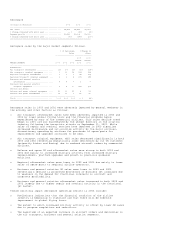
of $124 million in 2002 represented the pretax loss on the dispositions of
Specialty Materials Pharmaceutical Fine Chemicals (PFC) and Advanced Circuits
businesses and Automation and Control Solutions Consumer Products business
totaling $249 million, partially offset by the pretax gain on the disposition of
our Bendix Commercial Vehicle Systems (BCVS) business of $125 million. The
divestitures of these businesses reduced net sales and increased segment profit
in 2002 compared with 2001 by approximately $500 and $31 million, respectively.
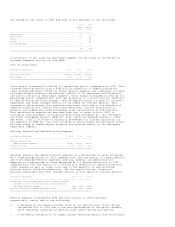
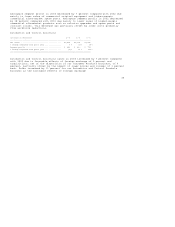
Asbestos Related Litigation Charges, Net of Insurance
(Dollars in Millions) 2003 2002 2001
--------------------------------------------------------------------------------
Asbestos related litigation charges, net of insurance ... $-- $1,548 $159
================================================================================
Asbestos related litigation charges, net of insurance related mainly to costs
associated with asbestos claims related to NARCO. See Asbestos Matters in Note
21 of Notes to Financial Statements for further discussion.
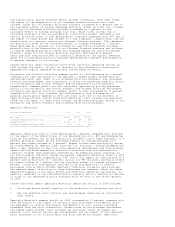
Business Impairment Charges
(Dollars in Millions) 2003 2002 2001
--------------------------------------------------------------------------------
Business impairment charges ............................... $-- $877 $145
================================================================================
Business impairment charges related principally to the write-down of property,
plant and equipment in businesses in our Specialty Materials reportable segment
and in our Friction Materials business. See the repositioning, litigation,
business impairment and other charges section of this MD&A for further details.
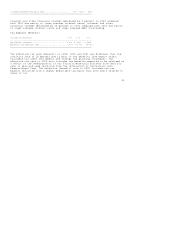
Equity in (Income) Loss of Affiliated Companies
(Dollars in Millions) 2003 2002 2001
--------------------------------------------------------------------------------
Equity in (income) loss of affiliated companies ........... $(38) $(42) $193
================================================================================
Equity income decreased by $4 million in 2003 compared with 2002 due to a charge
of $2 million in 2003 related to the sale of a Specialty Materials' equity
investee's investment. Also, 2002 included income of $15 million resulting from
exiting joint ventures in our Aerospace and Transportation Systems reportable
segments partially offset by a charge of $13 million for severance actions by
our UOP joint venture. Equity income increased by $235 million in 2002 compared
with 2001 mainly due to a $187 million decrease in repositioning and other
charges. See the repositioning, litigation, business impairment and other
charges section of this MD&A for further details. This increase also resulted
from an improvement in earnings of $23 million from joint ventures in our
Specialty Materials and Automation and Control Solutions reportable segments and
from income of $15 million resulting from exiting joint ventures in our
Aerospace and Transportation Systems reportable segments.
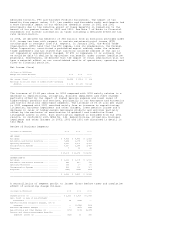
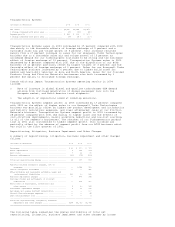
Other (Income) Expense
(Dollars in Millions) 2003 2002 2001
-------------------------------------------------------------------------------
Other (income) expense ................................... $19 $(4) $(17)
===============================================================================
Other expense increased by $23 million in 2003 compared with 2002 due mainly to
an increase of $65 million in foreign exchange losses resulting from weakness in
the U.S. dollar mainly against the EURO partially offset by a gain of $20
million related to a settlement of a patent infringement lawsuit and an increase
of $19 million in interest income from higher cash balances. Other income
decreased by $13 million in 2002 compared with 2001 due to an increase in
foreign exchange losses of $47 million and an increase in other charges of $9
million, largely offset by income of $15 million from a partial settlement of a
patent infringement lawsuit with an automotive supplier, lower minority
interests of $16 million and higher interest income of $13 million. The increase
of $9 million in other charges resulted from charges of $15 million in 2002
related to an other than temporary decline in value of cost basis equity
investments versus a $6 million loss in 2001 related to the early redemption of
our $200 million 5 3/4% dealer remarketable securities.
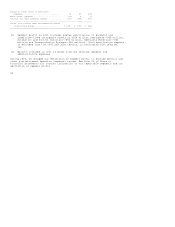
Interest and Other Financial Charges
(Dollars in Millions) 2003 2002 2001
-------------------------------------------------------------------------------
Interest and other financial charges ................... $335 $344 $405