Honeywell 2003 Annual Report Download - page 338
Download and view the complete annual report
Please find page 338 of the 2003 Honeywell annual report below. You can navigate through the pages in the report by either clicking on the pages listed below, or by using the keyword search tool below to find specific information within the annual report.-
 1
1 -
2
-
3
-
4
-
5
-
6
-
7
-
8
-
9
-
10
-
11
-
12
-
13
-
14
-
15
-
16
-
17
-
18
-
19
-
20
-
21
-
22
-
23
-
24
-
25
-
26
-
27
-
28
-
29
-
30
-
31
-
32
-
33
-
34
-
35
-
36
-
37
-
38
-
39
-
40
-
41
-
42
-
43
-
44
-
45
-
46
-
47
-
48
-
49
-
50
-
51
-
52
-
53
-
54
-
55
-
56
-
57
-
58
-
59
-
60
-
61
-
62
-
63
-
64
-
65
-
66
-
67
-
68
-
69
-
70
-
71
-
72
-
73
-
74
-
75
-
76
-
77
-
78
-
79
-
80
-
81
-
82
-
83
-
84
-
85
-
86
-
87
-
88
-
89
-
90
-
91
-
92
-
93
-
94
-
95
-
96
-
97
-
98
-
99
-
100
-
101
-
102
-
103
-
104
-
105
-
106
-
107
-
108
-
109
-
110
-
111
-
112
-
113
-
114
-
115
-
116
-
117
-
118
-
119
-
120
-
121
-
122
-
123
-
124
-
125
-
126
-
127
-
128
-
129
-
130
-
131
-
132
-
133
-
134
-
135
-
136
-
137
-
138
-
139
-
140
-
141
-
142
-
143
-
144
-
145
-
146
-
147
-
148
-
149
-
150
-
151
-
152
-
153
-
154
-
155
-
156
-
157
-
158
-
159
-
160
-
161
-
162
-
163
-
164
-
165
-
166
-
167
-
168
-
169
-
170
-
171
-
172
-
173
-
174
-
175
-
176
-
177
-
178
-
179
-
180
-
181
-
182
-
183
-
184
-
185
-
186
-
187
-
188
-
189
-
190
-
191
-
192
-
193
-
194
-
195
-
196
-
197
-
198
-
199
-
200
-
201
-
202
-
203
-
204
-
205
-
206
-
207
-
208
-
209
-
210
-
211
-
212
-
213
-
214
-
215
-
216
-
217
-
218
-
219
-
220
-
221
-
222
-
223
-
224
-
225
-
226
-
227
-
228
-
229
-
230
-
231
-
232
-
233
-
234
-
235
-
236
-
237
-
238
-
239
-
240
-
241
-
242
-
243
-
244
-
245
-
246
-
247
-
248
-
249
-
250
-
251
-
252
-
253
-
254
-
255
-
256
-
257
-
258
-
259
-
260
-
261
-
262
-
263
-
264
-
265
-
266
-
267
-
268
-
269
-
270
-
271
-
272
-
273
-
274
-
275
-
276
-
277
-
278
-
279
-
280
-
281
-
282
-
283
-
284
-
285
-
286
-
287
-
288
-
289
-
290
-
291
-
292
-
293
-
294
-
295
-
296
-
297
-
298
-
299
-
300
-
301
-
302
-
303
-
304
-
305
-
306
-
307
-
308
-
309
-
310
-
311
-
312
-
313
-
314
-
315
-
316
-
317
-
318
-
319
-
320
-
321
-
322
-
323
-
324
-
325
-
326
-
327
-
 328
328 -
 329
329 -
 330
330 -
 331
331 -
 332
332 -
 333
333 -
 334
334 -
 335
335 -
 336
336 -
 337
337 -
 338
338 -
 339
339 -
 340
340 -
 341
341 -
 342
342 -
 343
343 -
 344
344 -
 345
345 -
 346
346 -
 347
347 -
 348
348 -
349
-
350
-
351
-
352
-
353
-
354
-
355
-
356
-
357
-
358
-
359
-
360
-
361
-
362
-
363
-
364
-
365
-
366
-
367
-
368
-
369
-
370
-
371
-
372
-
373
-
374
-
375
-
376
-
377
-
378
-
379
-
380
-
381
-
382
-
383
-
384
-
385
-
386
-
387
-
388
-
389
-
390
-
391
-
392
-
393
-
394
-
395
-
396
-
397
-
398
-
399
-
400
-
401
-
402
-
403
-
404
-
405
-
406
-
407
-
408
-
409
-
410
-
411
-
412
-
413
-
414
-
415
-
416
-
417
-
418
-
419
-
420
-
421
-
422
-
423
-
424
-
425
-
426
-
427
-
428
-
429
-
430
-
431
-
432
-
433
-
434
-
435
-
436
-
437
-
438
-
439
-
440
-
441
-
442
-
443
-
444
 |
 |
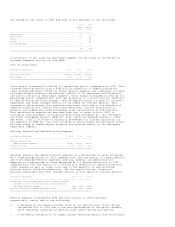
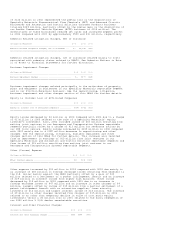
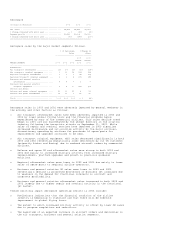
The change in net sales in 2003 and 2002 is attributable to the following:
2003 2002
Versus Versus
2002 2001
--------------------------------------------------------------------------------
Acquisitions ................................................. 3 % -- %
Divestitures ................................................. (2) (3)
Price ........................................................ -- (2)
Volume ....................................................... -- (2)
Foreign Exchange ............................................. 3 1
--------------------------------------------------------------------------------
4 % (6)%
================================================================================
A discussion of net sales by reportable segment can be found in the Review of
Business Segments section of this MD&A.
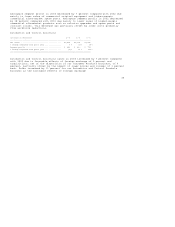
Cost of Goods Sold
(Dollars in Millions) 2003 2002 2001
-------------------------------------------------------------------------------
Cost of Goods Sold .............................. $18,235 $17,615 $20,125
Gross Margin % .................................. 21.1% 20.9% 14.9%
===============================================================================
Gross margin increased in 2003 by 0.2 percentage points compared with 2002. This
increase resulted mainly from a $289 million reduction in repositioning and
other charges partially offset by higher pension expense and a decrease in sales
of higher-margin products and services, mainly in our Aerospace and Automation
and Control Solutions reportable segments. Gross margin increased in 2002 by 6.0
percentage points compared with 2001 due primarily to a $1,573 million reduction
in repositioning and other charges. See the repositioning, litigation, business
impairment and other charges section of this MD&A for further details. This
increase in gross margin also resulted from lower costs due to the benefits of
repositioning actions, mainly workforce reductions, and the elimination of
goodwill and indefinite-lived intangible asset amortization of $204 million.
Such amortization expense was excluded from cost of goods sold in 2002 in
conformity with Statement of Financial Accounting Standards No. 142, "Goodwill
and Other Intangible Assets" (SFAS No. 142), which we adopted January 1, 2002.
See Notes 1 and 13 of Notes to Financial Statements for further discussion of
the adoption of SFAS No. 142. This increase in gross margin was partially offset
by lower sales of higher-margin products and services mainly in our Aerospace
reportable segment.
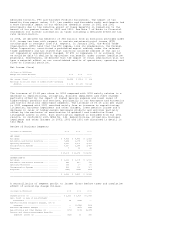
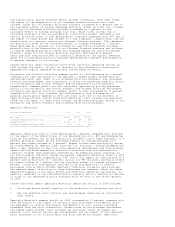
Selling, General and Administrative Expenses
(Dollars in Millions) 2003 2002 2001
-------------------------------------------------------------------------------
Selling, general and
administrative expenses ......................... $2,950 $2,757 $3,064
Percent of sales ................................... 12.8% 12.4% 13.0%
===============================================================================
Selling, general and administrative expenses as a percentage of sales increased
by 0.4 percentage points in 2003 compared with 2002 due mainly to higher pension
and other employee benefit expenses. Selling, general and administrative
expenses as a percentage of sales decreased by 0.6 percentage points in 2002
compared with 2001 due mainly to a $106 million reduction in repositioning and
other charges as well as lower costs due to the benefits of repositioning
actions, mainly workforce reductions. See the repositioning, litigation,
business impairment and other charges section of this MD&A for further details.
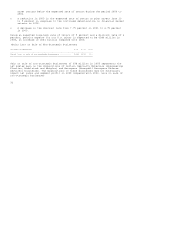
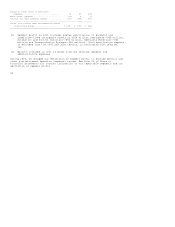
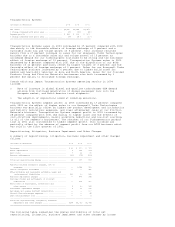
(Dollars in Millions) 2003 2002 2001
-------------------------------------------------------------------------------
Pension and other postretirement benefit expense (income)
included in cost of goods sold and selling, general
and administrative expenses .......................... $325 $(11) $(165)
Increase (decrease) compared with prior year ............ $336 $154 $(122)
===============================================================================
Pension expense increased by $290 and $151 million in 2003 and 2002,
respectively, mainly due to the following:
o A decrease in the market-related value of our pension plan assets during
the period 2000 to 2002 due to the poor performance of the equity markets
which adversely affected our pension fund assets during this period.
o A systematic recognition of higher losses resulting mainly from actual plan