Honeywell 2003 Annual Report Download - page 377
Download and view the complete annual report
Please find page 377 of the 2003 Honeywell annual report below. You can navigate through the pages in the report by either clicking on the pages listed below, or by using the keyword search tool below to find specific information within the annual report.-
 1
1 -
2
-
3
-
4
-
5
-
6
-
7
-
8
-
9
-
10
-
11
-
12
-
13
-
14
-
15
-
16
-
17
-
18
-
19
-
20
-
21
-
22
-
23
-
24
-
25
-
26
-
27
-
28
-
29
-
30
-
31
-
32
-
33
-
34
-
35
-
36
-
37
-
38
-
39
-
40
-
41
-
42
-
43
-
44
-
45
-
46
-
47
-
48
-
49
-
50
-
51
-
52
-
53
-
54
-
55
-
56
-
57
-
58
-
59
-
60
-
61
-
62
-
63
-
64
-
65
-
66
-
67
-
68
-
69
-
70
-
71
-
72
-
73
-
74
-
75
-
76
-
77
-
78
-
79
-
80
-
81
-
82
-
83
-
84
-
85
-
86
-
87
-
88
-
89
-
90
-
91
-
92
-
93
-
94
-
95
-
96
-
97
-
98
-
99
-
100
-
101
-
102
-
103
-
104
-
105
-
106
-
107
-
108
-
109
-
110
-
111
-
112
-
113
-
114
-
115
-
116
-
117
-
118
-
119
-
120
-
121
-
122
-
123
-
124
-
125
-
126
-
127
-
128
-
129
-
130
-
131
-
132
-
133
-
134
-
135
-
136
-
137
-
138
-
139
-
140
-
141
-
142
-
143
-
144
-
145
-
146
-
147
-
148
-
149
-
150
-
151
-
152
-
153
-
154
-
155
-
156
-
157
-
158
-
159
-
160
-
161
-
162
-
163
-
164
-
165
-
166
-
167
-
168
-
169
-
170
-
171
-
172
-
173
-
174
-
175
-
176
-
177
-
178
-
179
-
180
-
181
-
182
-
183
-
184
-
185
-
186
-
187
-
188
-
189
-
190
-
191
-
192
-
193
-
194
-
195
-
196
-
197
-
198
-
199
-
200
-
201
-
202
-
203
-
204
-
205
-
206
-
207
-
208
-
209
-
210
-
211
-
212
-
213
-
214
-
215
-
216
-
217
-
218
-
219
-
220
-
221
-
222
-
223
-
224
-
225
-
226
-
227
-
228
-
229
-
230
-
231
-
232
-
233
-
234
-
235
-
236
-
237
-
238
-
239
-
240
-
241
-
242
-
243
-
244
-
245
-
246
-
247
-
248
-
249
-
250
-
251
-
252
-
253
-
254
-
255
-
256
-
257
-
258
-
259
-
260
-
261
-
262
-
263
-
264
-
265
-
266
-
267
-
268
-
269
-
270
-
271
-
272
-
273
-
274
-
275
-
276
-
277
-
278
-
279
-
280
-
281
-
282
-
283
-
284
-
285
-
286
-
287
-
288
-
289
-
290
-
291
-
292
-
293
-
294
-
295
-
296
-
297
-
298
-
299
-
300
-
301
-
302
-
303
-
304
-
305
-
306
-
307
-
308
-
309
-
310
-
311
-
312
-
313
-
314
-
315
-
316
-
317
-
318
-
319
-
320
-
321
-
322
-
323
-
324
-
325
-
326
-
327
-
328
-
329
-
330
-
331
-
332
-
333
-
334
-
335
-
336
-
337
-
338
-
339
-
340
-
341
-
342
-
343
-
344
-
345
-
346
-
347
-
348
-
349
-
350
-
351
-
352
-
353
-
354
-
355
-
356
-
357
-
358
-
359
-
360
-
361
-
362
-
363
-
364
-
365
-
366
-
 367
367 -
 368
368 -
 369
369 -
 370
370 -
 371
371 -
 372
372 -
 373
373 -
 374
374 -
 375
375 -
 376
376 -
 377
377 -
 378
378 -
 379
379 -
 380
380 -
 381
381 -
 382
382 -
 383
383 -
 384
384 -
 385
385 -
 386
386 -
 387
387 -
388
-
389
-
390
-
391
-
392
-
393
-
394
-
395
-
396
-
397
-
398
-
399
-
400
-
401
-
402
-
403
-
404
-
405
-
406
-
407
-
408
-
409
-
410
-
411
-
412
-
413
-
414
-
415
-
416
-
417
-
418
-
419
-
420
-
421
-
422
-
423
-
424
-
425
-
426
-
427
-
428
-
429
-
430
-
431
-
432
-
433
-
434
-
435
-
436
-
437
-
438
-
439
-
440
-
441
-
442
-
443
-
444
 |
 |
resulted in the recognition of a non-cash charge of $31 million ($20 million
after-tax, or $0.02 per share) that is reported as a cumulative effect of an
accounting change. This accounting change did not have a material impact on
results of operations for 2003. Pro forma effects for 2002 and 2001 assuming
adoption of SFAS No. 143 as of January 1, 2001, were not material to net income
or per share amounts.
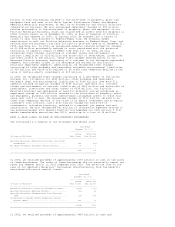
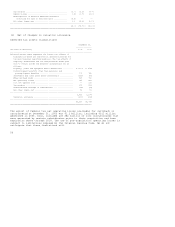
NOTE 2--ACQUISITIONS
We acquired businesses for an aggregate cost of $199, $520 and $122 million in
2003, 2002 and 2001, respectively. All our acquisitions were accounted for under
the purchase method of accounting, and accordingly, the assets and liabilities
of the acquired businesses were recorded at their estimated fair values at the
dates of acquisition. Significant acquisitions made in these years are discussed
below.
In May 2003, Honeywell sold its Engineering Plastics business to BASF in
exchange for BASF's nylon fiber business and $90 million in cash. BASF's nylon
fiber business became part of Specialty Materials' nylon business. Specialty
Materials' Engineering Plastics business and BASF's nylon fiber business both
have annual sales of approximately $400 million.
In October 2002 we acquired Invensys Sensor Systems (ISS) for approximately $416
million in cash with $115 million allocated to tangible net assets, $206 million
allocated to goodwill and $95 million allocated to other intangible assets with
determinable lives. ISS is a global supplier of sensors and controls used in the
medical, office automation, aerospace, HVAC, automotive, off-road vehicle and
consumer appliance industries. ISS is part of our Automation and Control
Products business in our Automation and Control Solutions reportable segment and
is expected to strengthen our product offerings in the high-growth medical and
automotive-onboard segments. ISS had sales of approximately $253 million in
2002.
In connection with all acquisitions in 2003, 2002 and 2001, the amounts recorded
for transaction costs and the costs of integrating the acquired businesses into
Honeywell were not material. The results of operations of all acquired
businesses have been included in the consolidated results of Honeywell from
their respective acquisition dates. The pro forma results for 2003, 2002 and
2001, assuming these acquisitions had been made at the beginning of the year,
would not be materially different from reported results.
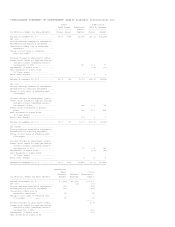
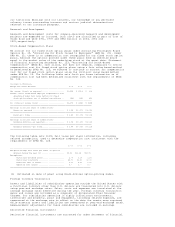
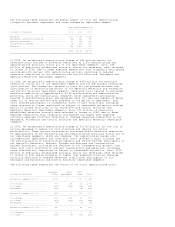
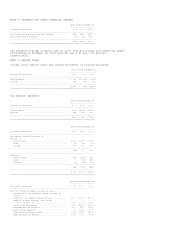
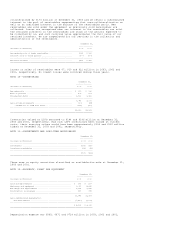
NOTE 3--REPOSITIONING, LITIGATION, BUSINESS IMPAIRMENT AND OTHER CHARGES
A summary of repositioning, litigation, business impairment and other charges
follows:
Years Ended December 31,
------------------------
(Dollars in Millions) 2003 2002 2001
--------------------------------------------------------------------------------
Severance ........................................... $ 69 $ 270 $ 727
Asset impairments ................................... 6 121 194
Exit costs .......................................... 7 62 95
Reserve adjustments ................................. (69) (76) (119)
--------------------------------------------------------------------------------
Total net repositioning charge ...................... 13 377 897
--------------------------------------------------------------------------------
Asbestos related litigation charges, net of
insurance ........................................ -- 1,548 159
Litton litigation settlement ........................ -- -- 440
Other probable and reasonably estimable legal and
environmental liabilities ........................ 261 30 249
Business impairment charges ......................... -- 877 145
Customer claims and settlements of contract
liabilities ...................................... -- 152 310
Write-offs of receivables, inventories and other
assets ........................................... 2 60 335
Investment impairment charges ....................... 2 15 112
Aerospace jet engine contract cancellation .......... -- -- 100
General Electric merger expenses .................... -- -- 42
Debt extinguishment loss ............................ -- -- 6
--------------------------------------------------------------------------------
Total net repositioning, litigation, business
impairment and other charges ..................... $278 $3,059 $2,795
================================================================================
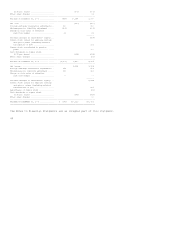
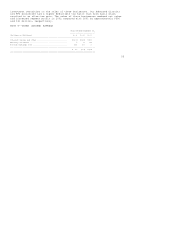
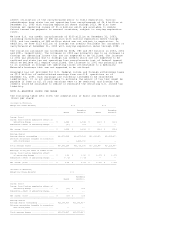
The following table summarizes the pretax distribution of total net
repositioning, litigation, business impairment and other charges by income
statement classification.
Years Ended December 31,
------------------------