Honeywell 2003 Annual Report Download - page 373
Download and view the complete annual report
Please find page 373 of the 2003 Honeywell annual report below. You can navigate through the pages in the report by either clicking on the pages listed below, or by using the keyword search tool below to find specific information within the annual report.-
 1
1 -
2
-
3
-
4
-
5
-
6
-
7
-
8
-
9
-
10
-
11
-
12
-
13
-
14
-
15
-
16
-
17
-
18
-
19
-
20
-
21
-
22
-
23
-
24
-
25
-
26
-
27
-
28
-
29
-
30
-
31
-
32
-
33
-
34
-
35
-
36
-
37
-
38
-
39
-
40
-
41
-
42
-
43
-
44
-
45
-
46
-
47
-
48
-
49
-
50
-
51
-
52
-
53
-
54
-
55
-
56
-
57
-
58
-
59
-
60
-
61
-
62
-
63
-
64
-
65
-
66
-
67
-
68
-
69
-
70
-
71
-
72
-
73
-
74
-
75
-
76
-
77
-
78
-
79
-
80
-
81
-
82
-
83
-
84
-
85
-
86
-
87
-
88
-
89
-
90
-
91
-
92
-
93
-
94
-
95
-
96
-
97
-
98
-
99
-
100
-
101
-
102
-
103
-
104
-
105
-
106
-
107
-
108
-
109
-
110
-
111
-
112
-
113
-
114
-
115
-
116
-
117
-
118
-
119
-
120
-
121
-
122
-
123
-
124
-
125
-
126
-
127
-
128
-
129
-
130
-
131
-
132
-
133
-
134
-
135
-
136
-
137
-
138
-
139
-
140
-
141
-
142
-
143
-
144
-
145
-
146
-
147
-
148
-
149
-
150
-
151
-
152
-
153
-
154
-
155
-
156
-
157
-
158
-
159
-
160
-
161
-
162
-
163
-
164
-
165
-
166
-
167
-
168
-
169
-
170
-
171
-
172
-
173
-
174
-
175
-
176
-
177
-
178
-
179
-
180
-
181
-
182
-
183
-
184
-
185
-
186
-
187
-
188
-
189
-
190
-
191
-
192
-
193
-
194
-
195
-
196
-
197
-
198
-
199
-
200
-
201
-
202
-
203
-
204
-
205
-
206
-
207
-
208
-
209
-
210
-
211
-
212
-
213
-
214
-
215
-
216
-
217
-
218
-
219
-
220
-
221
-
222
-
223
-
224
-
225
-
226
-
227
-
228
-
229
-
230
-
231
-
232
-
233
-
234
-
235
-
236
-
237
-
238
-
239
-
240
-
241
-
242
-
243
-
244
-
245
-
246
-
247
-
248
-
249
-
250
-
251
-
252
-
253
-
254
-
255
-
256
-
257
-
258
-
259
-
260
-
261
-
262
-
263
-
264
-
265
-
266
-
267
-
268
-
269
-
270
-
271
-
272
-
273
-
274
-
275
-
276
-
277
-
278
-
279
-
280
-
281
-
282
-
283
-
284
-
285
-
286
-
287
-
288
-
289
-
290
-
291
-
292
-
293
-
294
-
295
-
296
-
297
-
298
-
299
-
300
-
301
-
302
-
303
-
304
-
305
-
306
-
307
-
308
-
309
-
310
-
311
-
312
-
313
-
314
-
315
-
316
-
317
-
318
-
319
-
320
-
321
-
322
-
323
-
324
-
325
-
326
-
327
-
328
-
329
-
330
-
331
-
332
-
333
-
334
-
335
-
336
-
337
-
338
-
339
-
340
-
341
-
342
-
343
-
344
-
345
-
346
-
347
-
348
-
349
-
350
-
351
-
352
-
353
-
354
-
355
-
356
-
357
-
358
-
359
-
360
-
361
-
362
-
 363
363 -
 364
364 -
 365
365 -
 366
366 -
 367
367 -
 368
368 -
 369
369 -
 370
370 -
 371
371 -
 372
372 -
 373
373 -
 374
374 -
 375
375 -
 376
376 -
 377
377 -
 378
378 -
 379
379 -
 380
380 -
 381
381 -
 382
382 -
 383
383 -
384
-
385
-
386
-
387
-
388
-
389
-
390
-
391
-
392
-
393
-
394
-
395
-
396
-
397
-
398
-
399
-
400
-
401
-
402
-
403
-
404
-
405
-
406
-
407
-
408
-
409
-
410
-
411
-
412
-
413
-
414
-
415
-
416
-
417
-
418
-
419
-
420
-
421
-
422
-
423
-
424
-
425
-
426
-
427
-
428
-
429
-
430
-
431
-
432
-
433
-
434
-
435
-
436
-
437
-
438
-
439
-
440
-
441
-
442
-
443
-
444
 |
 |
our historical dealings with our insurers, our knowledge of any pertinent
solvency issues surrounding insurers and various judicial determinations
relevant to our insurance programs.
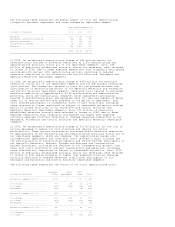
Research and Development
Research and development costs for company-sponsored research and development
projects are expensed as incurred. Such costs are classified as part of Cost of
Goods Sold and were $751, $757 and $832 million in 2003, 2002 and
2001,respectively.
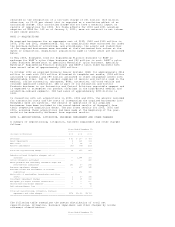
Stock-Based Compensation Plans
We account for our fixed stock option plans under Accounting Principles Board
Opinion No. 25, "Accounting for Stock Issued to Employees" (APB No. 25). Under
APB No. 25, there is no compensation cost recognized for our fixed stock option
plans, because the options granted under these plans have an exercise price
equal to the market value of the underlying stock at the grant date. Statement
of Financial Accounting Standards No. 123, "Accounting for Stock-Based
Compensation" (SFAS No. 123) allows, but does not require, companies to record
compensation cost for fixed stock option plans using a fair value based method.
As permitted by SFAS No. 123, we elected to continue to account for compensation
cost for our fixed stock option plans using the intrinsic value based method
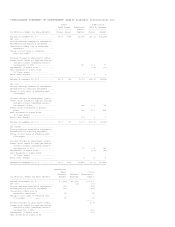
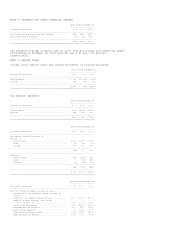
under APB No. 25. The following table sets forth pro forma information as if
compensation cost had been determined consistent with the requirements of SFAS
No. 123.
(Dollars in Millions,
Except Per Share Amounts) 2003 2002 2001
-------------------------------------------------------------------------------
Net income (loss), as reported ..................... $1,324 $ (220) $ (99)
Deduct: Total stock-based employee compensation cost
determined under fair value method for fixed
stock option plans, net of related tax effects .. (48) (64) (85)
-------------------------------------------------------------------------------
Pro forma net income (loss) ........................ $1,276 $ (284) $ (184)
===============================================================================
Earnings (loss) per share of common stock:
Basic--as reported .............................. $ 1.54 $(0.27) $(0.12)
===============================================================================
Basic--pro forma ................................ $ 1.48 $(0.35) $(0.23)
===============================================================================
Earnings (loss) per share of common stock:
Assuming dilution--as reported .................. $ 1.54 $(0.27) $(0.12)
===============================================================================
Assuming dilution--pro forma .................... $ 1.48 $(0.35) $(0.23)
===============================================================================
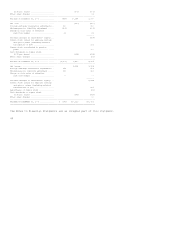
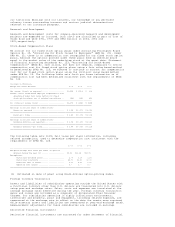
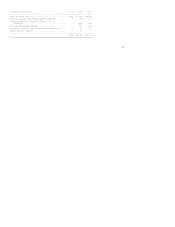
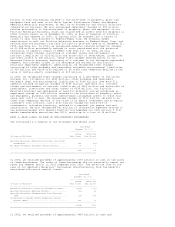
The following table sets forth fair value per share information, including
related assumptions, used to determine compensation cost consistent with the
requirements of SFAS No. 123.
2003 2002 2001
------------------------------------------------------------------------------
Weighted average fair value per share of options
granted during the year (1) ..................... $8.82 $12.64 $13.71
Assumptions:
Historical dividend yield .................... 2.0% 1.9% 1.5%
Historical volatility ........................ 46.7% 43.8% 40.9%
Risk-free rate of return ..................... 2.9% 4.2% 5.2%
Expected life (years) ........................ 5.0 5.0 5.0
==============================================================================
(1) Estimated on date of grant using Black-Scholes option-pricing model.
Foreign Currency Translation
Assets and liabilities of subsidiaries operating outside the United States with
a functional currency other than U.S. dollars are translated into U.S. dollars
using year-end exchange rates. Sales, costs and expenses are translated at the
average exchange rates effective during the year. Foreign currency translation
gains and losses are included as a component of Accumulated Other Nonowner
Changes. For subsidiaries operating in highly inflationary environments,
inventories and property, plant and equipment, including related expenses, are
remeasured at the exchange rate in effect on the date the assets were acquired,
while monetary assets and liabilities are remeasured at year-end exchange rates.
Remeasurement adjustments for these subsidiaries are included in earnings.
Derivative Financial Instruments
Derivative financial instruments are accounted for under Statement of Financial