Honeywell 2003 Annual Report Download - page 342
Download and view the complete annual report
Please find page 342 of the 2003 Honeywell annual report below. You can navigate through the pages in the report by either clicking on the pages listed below, or by using the keyword search tool below to find specific information within the annual report.-
 1
1 -
2
-
3
-
4
-
5
-
6
-
7
-
8
-
9
-
10
-
11
-
12
-
13
-
14
-
15
-
16
-
17
-
18
-
19
-
20
-
21
-
22
-
23
-
24
-
25
-
26
-
27
-
28
-
29
-
30
-
31
-
32
-
33
-
34
-
35
-
36
-
37
-
38
-
39
-
40
-
41
-
42
-
43
-
44
-
45
-
46
-
47
-
48
-
49
-
50
-
51
-
52
-
53
-
54
-
55
-
56
-
57
-
58
-
59
-
60
-
61
-
62
-
63
-
64
-
65
-
66
-
67
-
68
-
69
-
70
-
71
-
72
-
73
-
74
-
75
-
76
-
77
-
78
-
79
-
80
-
81
-
82
-
83
-
84
-
85
-
86
-
87
-
88
-
89
-
90
-
91
-
92
-
93
-
94
-
95
-
96
-
97
-
98
-
99
-
100
-
101
-
102
-
103
-
104
-
105
-
106
-
107
-
108
-
109
-
110
-
111
-
112
-
113
-
114
-
115
-
116
-
117
-
118
-
119
-
120
-
121
-
122
-
123
-
124
-
125
-
126
-
127
-
128
-
129
-
130
-
131
-
132
-
133
-
134
-
135
-
136
-
137
-
138
-
139
-
140
-
141
-
142
-
143
-
144
-
145
-
146
-
147
-
148
-
149
-
150
-
151
-
152
-
153
-
154
-
155
-
156
-
157
-
158
-
159
-
160
-
161
-
162
-
163
-
164
-
165
-
166
-
167
-
168
-
169
-
170
-
171
-
172
-
173
-
174
-
175
-
176
-
177
-
178
-
179
-
180
-
181
-
182
-
183
-
184
-
185
-
186
-
187
-
188
-
189
-
190
-
191
-
192
-
193
-
194
-
195
-
196
-
197
-
198
-
199
-
200
-
201
-
202
-
203
-
204
-
205
-
206
-
207
-
208
-
209
-
210
-
211
-
212
-
213
-
214
-
215
-
216
-
217
-
218
-
219
-
220
-
221
-
222
-
223
-
224
-
225
-
226
-
227
-
228
-
229
-
230
-
231
-
232
-
233
-
234
-
235
-
236
-
237
-
238
-
239
-
240
-
241
-
242
-
243
-
244
-
245
-
246
-
247
-
248
-
249
-
250
-
251
-
252
-
253
-
254
-
255
-
256
-
257
-
258
-
259
-
260
-
261
-
262
-
263
-
264
-
265
-
266
-
267
-
268
-
269
-
270
-
271
-
272
-
273
-
274
-
275
-
276
-
277
-
278
-
279
-
280
-
281
-
282
-
283
-
284
-
285
-
286
-
287
-
288
-
289
-
290
-
291
-
292
-
293
-
294
-
295
-
296
-
297
-
298
-
299
-
300
-
301
-
302
-
303
-
304
-
305
-
306
-
307
-
308
-
309
-
310
-
311
-
312
-
313
-
314
-
315
-
316
-
317
-
318
-
319
-
320
-
321
-
322
-
323
-
324
-
325
-
326
-
327
-
328
-
329
-
330
-
331
-
 332
332 -
 333
333 -
 334
334 -
 335
335 -
 336
336 -
 337
337 -
 338
338 -
 339
339 -
 340
340 -
 341
341 -
 342
342 -
 343
343 -
 344
344 -
 345
345 -
 346
346 -
 347
347 -
 348
348 -
 349
349 -
 350
350 -
 351
351 -
 352
352 -
353
-
354
-
355
-
356
-
357
-
358
-
359
-
360
-
361
-
362
-
363
-
364
-
365
-
366
-
367
-
368
-
369
-
370
-
371
-
372
-
373
-
374
-
375
-
376
-
377
-
378
-
379
-
380
-
381
-
382
-
383
-
384
-
385
-
386
-
387
-
388
-
389
-
390
-
391
-
392
-
393
-
394
-
395
-
396
-
397
-
398
-
399
-
400
-
401
-
402
-
403
-
404
-
405
-
406
-
407
-
408
-
409
-
410
-
411
-
412
-
413
-
414
-
415
-
416
-
417
-
418
-
419
-
420
-
421
-
422
-
423
-
424
-
425
-
426
-
427
-
428
-
429
-
430
-
431
-
432
-
433
-
434
-
435
-
436
-
437
-
438
-
439
-
440
-
441
-
442
-
443
-
444
 |
 |
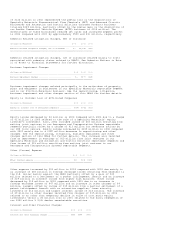
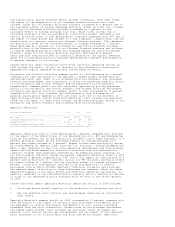
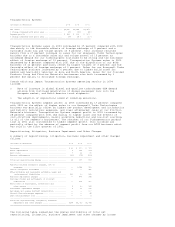
Advanced Circuits, PFC and Consumer Products businesses. The impact of tax
benefits from export sales, U.S. tax credits and favorable audit settlements had
a more favorable impact on our effective (benefit) rates in 2002 and 2001
principally due to the relative amount of these benefits in comparison to the
amount of our pretax losses in 2002 and 2001. See Note 7 of Notes to Financial
Statements for further information on taxes including a detailed effective tax
rate reconciliation.
In 2003, we derived tax benefits of $60 million from an exclusion provided under
U.S. income tax laws with respect to certain extraterritorial income (ETI)
attributable to receipts from U.S. exports. In January 2002, the World Trade
Organization (WTO) held that the ETI regime, like its predecessor, the Foreign
Sales Corporation, constituted a prohibited export subsidy under the relevant
trade agreements and has stated that sanctions would be imposed if the law is
not repealed or appropriately changed. If ETI is repealed, it is unlikely that
we would be able to realize an equivalent tax benefit under current legislative
proposals. Nonetheless, we believe that the impact of final legislation will not
have a material effect on our consolidated results of operations, operating cash
flows or financial position.
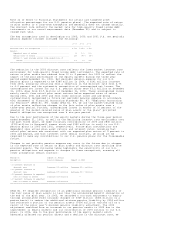
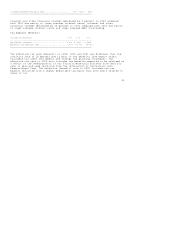
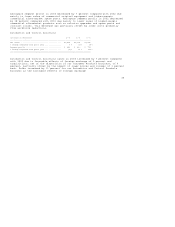
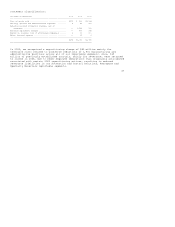
Net Income (Loss)
(Dollars in Millions,
Except Per Share Amounts) 2003 2002 2001
-------------------------------------------------------------------------------
Net income (loss) .................................. $1,324 $ (220) $ (99)
Earnings (loss) per share of common stock--assuming
dilution ........................................ $ 1.54 $(0.27) $(0.12)
===============================================================================
The increase of $1.81 per share in 2003 compared with 2002 mainly relates to a
decrease in repositioning, litigation, business impairment and other charges
partially offset by the impact of higher pension expense and lower sales of
higher-margin products and services, principally in our Aerospace and Automation
and Control Solutions reportable segments. The increase of $0.15 loss per share
in 2002 compared with 2001 resulted mainly from an increase in repositioning,
litigation, business impairment and other charges, lower pension income and a
decrease in sales of higher-margin Aerospace products and services partially
offset by the exclusion of amortization of goodwill and indefinite-lived
intangible assets in 2002. Such amortization expense is excluded from the 2002
results, in conformity with SFAS No. 142. Repositioning, litigation, business
impairment and other charges in 2003, 2002 and 2001 are discussed in detail in
this MD&A.
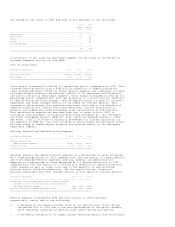
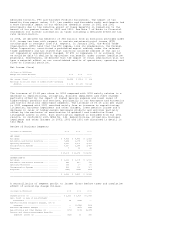
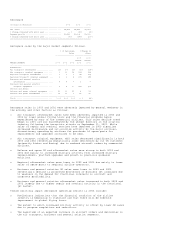
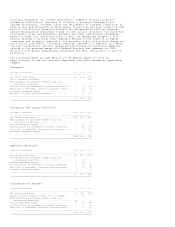
Review of Business Segments
(Dollars in Millions) 2003 2002 2001
-------------------------------------------------------------------------------
NET SALES
Aerospace .................................... $ 8,813 $ 8,855 $ 9,653
Automation and Control Solutions ............. 7,464 6,978 7,185
Specialty Materials .......................... 3,169 3,205 3,313
Transportation Systems ....................... 3,650 3,184 3,457
Corporate .................................... 7 52 44
-------------------------------------------------------------------------------
$ 23,103 $ 22,274 $ 23,652
===============================================================================
SEGMENT PROFIT
Aerospace .................................... $ 1,221 $ 1,308 $ 1,599
Automation and Control Solutions ............. 843 860 774
Specialty Materials .......................... 136 90 56
Transportation Systems ....................... 461 393 307
Corporate .................................... (142) (154) (153)
-------------------------------------------------------------------------------
$ 2,519 $ 2,497 $ 2,583
===============================================================================
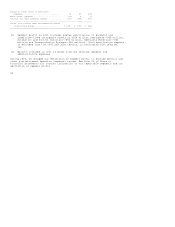
A reconciliation of segment profit to income (loss) before taxes and cumulative
effect of accounting change follows:
(Dollars in Millions) 2003 2002 2001
-------------------------------------------------------------------------------
Segment profit (1) .............................. $ 2,519 $ 2,497 $ 2,583
Gain (loss) on sale of non-strategic
businesses ................................... 38 (124) --
Asbestos related litigation charges, net of
insurance .................................... -- (1,548) (159)
Business impairment charges ..................... -- (877) (145)
Repositioning and other charges (2) ............. (276) (606) (2,285)
Pension and other postretirement benefits
(expense) income (2) ......................... (325) 11 165