Honeywell 2003 Annual Report Download - page 417
Download and view the complete annual report
Please find page 417 of the 2003 Honeywell annual report below. You can navigate through the pages in the report by either clicking on the pages listed below, or by using the keyword search tool below to find specific information within the annual report.-
 1
1 -
2
-
3
-
4
-
5
-
6
-
7
-
8
-
9
-
10
-
11
-
12
-
13
-
14
-
15
-
16
-
17
-
18
-
19
-
20
-
21
-
22
-
23
-
24
-
25
-
26
-
27
-
28
-
29
-
30
-
31
-
32
-
33
-
34
-
35
-
36
-
37
-
38
-
39
-
40
-
41
-
42
-
43
-
44
-
45
-
46
-
47
-
48
-
49
-
50
-
51
-
52
-
53
-
54
-
55
-
56
-
57
-
58
-
59
-
60
-
61
-
62
-
63
-
64
-
65
-
66
-
67
-
68
-
69
-
70
-
71
-
72
-
73
-
74
-
75
-
76
-
77
-
78
-
79
-
80
-
81
-
82
-
83
-
84
-
85
-
86
-
87
-
88
-
89
-
90
-
91
-
92
-
93
-
94
-
95
-
96
-
97
-
98
-
99
-
100
-
101
-
102
-
103
-
104
-
105
-
106
-
107
-
108
-
109
-
110
-
111
-
112
-
113
-
114
-
115
-
116
-
117
-
118
-
119
-
120
-
121
-
122
-
123
-
124
-
125
-
126
-
127
-
128
-
129
-
130
-
131
-
132
-
133
-
134
-
135
-
136
-
137
-
138
-
139
-
140
-
141
-
142
-
143
-
144
-
145
-
146
-
147
-
148
-
149
-
150
-
151
-
152
-
153
-
154
-
155
-
156
-
157
-
158
-
159
-
160
-
161
-
162
-
163
-
164
-
165
-
166
-
167
-
168
-
169
-
170
-
171
-
172
-
173
-
174
-
175
-
176
-
177
-
178
-
179
-
180
-
181
-
182
-
183
-
184
-
185
-
186
-
187
-
188
-
189
-
190
-
191
-
192
-
193
-
194
-
195
-
196
-
197
-
198
-
199
-
200
-
201
-
202
-
203
-
204
-
205
-
206
-
207
-
208
-
209
-
210
-
211
-
212
-
213
-
214
-
215
-
216
-
217
-
218
-
219
-
220
-
221
-
222
-
223
-
224
-
225
-
226
-
227
-
228
-
229
-
230
-
231
-
232
-
233
-
234
-
235
-
236
-
237
-
238
-
239
-
240
-
241
-
242
-
243
-
244
-
245
-
246
-
247
-
248
-
249
-
250
-
251
-
252
-
253
-
254
-
255
-
256
-
257
-
258
-
259
-
260
-
261
-
262
-
263
-
264
-
265
-
266
-
267
-
268
-
269
-
270
-
271
-
272
-
273
-
274
-
275
-
276
-
277
-
278
-
279
-
280
-
281
-
282
-
283
-
284
-
285
-
286
-
287
-
288
-
289
-
290
-
291
-
292
-
293
-
294
-
295
-
296
-
297
-
298
-
299
-
300
-
301
-
302
-
303
-
304
-
305
-
306
-
307
-
308
-
309
-
310
-
311
-
312
-
313
-
314
-
315
-
316
-
317
-
318
-
319
-
320
-
321
-
322
-
323
-
324
-
325
-
326
-
327
-
328
-
329
-
330
-
331
-
332
-
333
-
334
-
335
-
336
-
337
-
338
-
339
-
340
-
341
-
342
-
343
-
344
-
345
-
346
-
347
-
348
-
349
-
350
-
351
-
352
-
353
-
354
-
355
-
356
-
357
-
358
-
359
-
360
-
361
-
362
-
363
-
364
-
365
-
366
-
367
-
368
-
369
-
370
-
371
-
372
-
373
-
374
-
375
-
376
-
377
-
378
-
379
-
380
-
381
-
382
-
383
-
384
-
385
-
386
-
387
-
388
-
389
-
390
-
391
-
392
-
393
-
394
-
395
-
396
-
397
-
398
-
399
-
400
-
401
-
402
-
403
-
404
-
405
-
406
-
 407
407 -
 408
408 -
 409
409 -
 410
410 -
 411
411 -
 412
412 -
 413
413 -
 414
414 -
 415
415 -
 416
416 -
 417
417 -
 418
418 -
 419
419 -
 420
420 -
 421
421 -
 422
422 -
 423
423 -
 424
424 -
 425
425 -
 426
426 -
 427
427 -
428
-
429
-
430
-
431
-
432
-
433
-
434
-
435
-
436
-
437
-
438
-
439
-
440
-
441
-
442
-
443
-
444
 |
 |
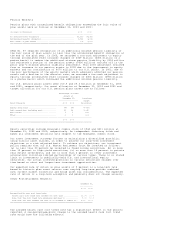
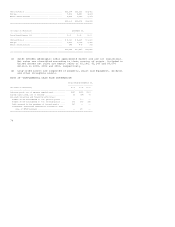
ing and guidance on the application of actuarial equivalence is also pending.
Based on the current uncertainties surrounding the accounting for the Act, we
believe that it is not possible to reasonably estimate the effect of the Act
until such guidance is issued. Therefore, all measures of accumulated
postretirement benefit obligation and net periodic postretirement benefit cost
reflected in the financial statements and accompanying notes do not reflect the
effects of the Act on our plans. We recognize that when guidance on the
accounting for the federal subsidy is issued, we may be required to change
previously reported information.
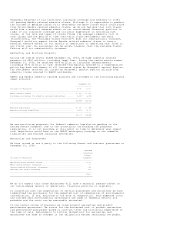
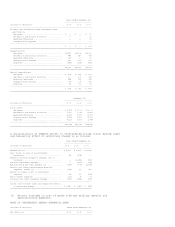
Employee Savings Plans
We sponsor employee savings plans under which we match, in the form of our
common stock, certain eligible U.S. employee savings plan contributions. Shares
issued under the stock match plans were 6.5, 5.6 and 4.9 million in 2003, 2002
and 2001, respectively, at a cost of $173, $173 and $185 million, respectively.
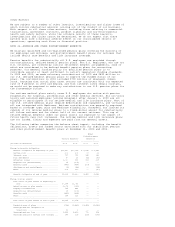
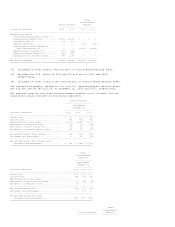
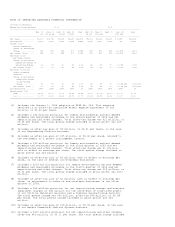
NOTE 23--SEGMENT FINANCIAL DATA
We globally manage our business operations through strategic business units
(SBUs) serving customers worldwide with aerospace products and services,
control, sensing and security technologies for buildings, homes and industry,
automotive products and chemicals. Segment information is consistent with how
management reviews the businesses, makes investing and resource allocation
decisions and assesses operating performance. Based on similar economic and
operational characteristics, our SBUs are aggregated and managed in four
reportable segments as follows:
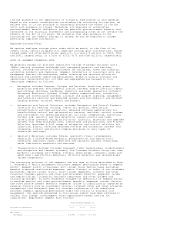
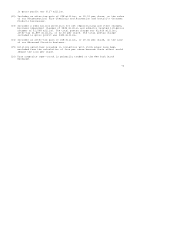
o Aerospace includes Engines, Systems and Services (auxiliary power units;
propulsion engines; environmental control systems; engine controls; repair
and overhaul services; hardware; logistics and power generation systems);
Aerospace Electronic Systems (flight safety communications, navigation,
radar and surveillance systems; aircraft and airport lighting; management
and technical services and advanced systems and instruments); and Aircraft
Landing Systems (aircraft wheels and brakes).
o Automation and Control Solutions includes Automation and Control Products
(controls for heating, cooling, indoor air quality, ventilation,
humidification and home automation; advanced software applications for
home/building control and optimization; sensors, switches, control systems
and instruments for measuring pressure, air flow, temperature, electrical
current and, security and fire detection, access control and video
surveillance systems); Building Solutions (installs, maintains and upgrades
systems that keep buildings safe, comfortable and productive); and Process
Solutions (provides a full range of automation and control solutions for
industrial plants, offering advanced software and automation systems that
integrate, control and monitor complex processes in many types of
industrial settings).
o Specialty Materials includes fibers; specialty films; intermediate
chemicals; fluorine-based products; pharmaceutical and agricultural
chemicals; specialty waxes, adhesives and sealants; process technology;
wafer fabrication materials and services.
o Transportation Systems includes Honeywell Turbo Technologies (turbochargers
and charge-air and thermal systems); the Consumer Products Group (car care
products including anti-freeze, filters, spark plugs, cleaners, waxes and
additives); and Friction Materials (friction materials and related brake
system components).
The accounting policies of the segments are the same as those described in Note
1. Honeywell's senior management evaluates segment performance based on segment
profit. Segment profit is business unit income (loss) before taxes excluding
general corporate unallocated expenses, gains (losses) on sales of non-strategic
businesses, equity income (loss), other income (expense), interest and other
financial charges, pension and other postretirement benefits (expense) income
and repositioning, litigation, business impairment and other charges and
accounting changes. In 2003, Honeywell changed its definition of segment profit
to exclude pension and other postretirement benefits (expense) income. Pension
and other postretirement benefits (expense) income is significantly impacted by
external factors such as investment returns, interest rates and other actuarial
assumptions that Honeywell does not consider indicative of the underlying
business segment operating performance under the control of business unit
management. All periods presented in this annual report have been restated to
reflect this change. Intersegment sales approximate market and are not
significant. Reportable segment data follows:
Years Ended December 31,
---------------------------
(Dollars in Millions) 2003 2002 2001
-----------------------------------------------------------------------------------
Net sales
Aerospace ........................................ $ 8,813 $ 8,855 $ 9,653