Honeywell 2003 Annual Report Download - page 387
Download and view the complete annual report
Please find page 387 of the 2003 Honeywell annual report below. You can navigate through the pages in the report by either clicking on the pages listed below, or by using the keyword search tool below to find specific information within the annual report.-
 1
1 -
2
-
3
-
4
-
5
-
6
-
7
-
8
-
9
-
10
-
11
-
12
-
13
-
14
-
15
-
16
-
17
-
18
-
19
-
20
-
21
-
22
-
23
-
24
-
25
-
26
-
27
-
28
-
29
-
30
-
31
-
32
-
33
-
34
-
35
-
36
-
37
-
38
-
39
-
40
-
41
-
42
-
43
-
44
-
45
-
46
-
47
-
48
-
49
-
50
-
51
-
52
-
53
-
54
-
55
-
56
-
57
-
58
-
59
-
60
-
61
-
62
-
63
-
64
-
65
-
66
-
67
-
68
-
69
-
70
-
71
-
72
-
73
-
74
-
75
-
76
-
77
-
78
-
79
-
80
-
81
-
82
-
83
-
84
-
85
-
86
-
87
-
88
-
89
-
90
-
91
-
92
-
93
-
94
-
95
-
96
-
97
-
98
-
99
-
100
-
101
-
102
-
103
-
104
-
105
-
106
-
107
-
108
-
109
-
110
-
111
-
112
-
113
-
114
-
115
-
116
-
117
-
118
-
119
-
120
-
121
-
122
-
123
-
124
-
125
-
126
-
127
-
128
-
129
-
130
-
131
-
132
-
133
-
134
-
135
-
136
-
137
-
138
-
139
-
140
-
141
-
142
-
143
-
144
-
145
-
146
-
147
-
148
-
149
-
150
-
151
-
152
-
153
-
154
-
155
-
156
-
157
-
158
-
159
-
160
-
161
-
162
-
163
-
164
-
165
-
166
-
167
-
168
-
169
-
170
-
171
-
172
-
173
-
174
-
175
-
176
-
177
-
178
-
179
-
180
-
181
-
182
-
183
-
184
-
185
-
186
-
187
-
188
-
189
-
190
-
191
-
192
-
193
-
194
-
195
-
196
-
197
-
198
-
199
-
200
-
201
-
202
-
203
-
204
-
205
-
206
-
207
-
208
-
209
-
210
-
211
-
212
-
213
-
214
-
215
-
216
-
217
-
218
-
219
-
220
-
221
-
222
-
223
-
224
-
225
-
226
-
227
-
228
-
229
-
230
-
231
-
232
-
233
-
234
-
235
-
236
-
237
-
238
-
239
-
240
-
241
-
242
-
243
-
244
-
245
-
246
-
247
-
248
-
249
-
250
-
251
-
252
-
253
-
254
-
255
-
256
-
257
-
258
-
259
-
260
-
261
-
262
-
263
-
264
-
265
-
266
-
267
-
268
-
269
-
270
-
271
-
272
-
273
-
274
-
275
-
276
-
277
-
278
-
279
-
280
-
281
-
282
-
283
-
284
-
285
-
286
-
287
-
288
-
289
-
290
-
291
-
292
-
293
-
294
-
295
-
296
-
297
-
298
-
299
-
300
-
301
-
302
-
303
-
304
-
305
-
306
-
307
-
308
-
309
-
310
-
311
-
312
-
313
-
314
-
315
-
316
-
317
-
318
-
319
-
320
-
321
-
322
-
323
-
324
-
325
-
326
-
327
-
328
-
329
-
330
-
331
-
332
-
333
-
334
-
335
-
336
-
337
-
338
-
339
-
340
-
341
-
342
-
343
-
344
-
345
-
346
-
347
-
348
-
349
-
350
-
351
-
352
-
353
-
354
-
355
-
356
-
357
-
358
-
359
-
360
-
361
-
362
-
363
-
364
-
365
-
366
-
367
-
368
-
369
-
370
-
371
-
372
-
373
-
374
-
375
-
376
-
 377
377 -
 378
378 -
 379
379 -
 380
380 -
 381
381 -
 382
382 -
 383
383 -
 384
384 -
 385
385 -
 386
386 -
 387
387 -
 388
388 -
 389
389 -
 390
390 -
 391
391 -
 392
392 -
 393
393 -
 394
394 -
 395
395 -
 396
396 -
 397
397 -
398
-
399
-
400
-
401
-
402
-
403
-
404
-
405
-
406
-
407
-
408
-
409
-
410
-
411
-
412
-
413
-
414
-
415
-
416
-
417
-
418
-
419
-
420
-
421
-
422
-
423
-
424
-
425
-
426
-
427
-
428
-
429
-
430
-
431
-
432
-
433
-
434
-
435
-
436
-
437
-
438
-
439
-
440
-
441
-
442
-
443
-
444
 |
 |
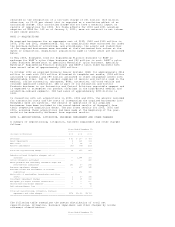
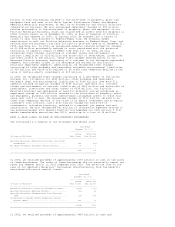
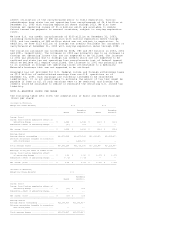
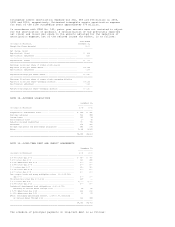
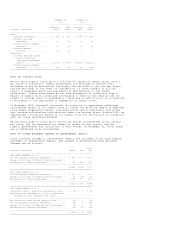
collateralized by $174 million at December 31, 2003 and we retain a subordinated
interest in the pool of receivables representing that over-collateralization as
well as an undivided interest in the balance of the receivables pools. New
receivables are sold under the agreement as previously sold receivables are
collected. Losses are recognized when our interest in the receivables are sold.
The retained interests in the receivables are shown at the amounts expected to
be collected by us, and such carrying value approximates the fair value of our
retained interests. We are compensated for our services in the collection and
administration of the receivables.
December 31,
-------------
(Dollars in Millions) 2003 2002
--------------------------------------------------------------------------------
Designated pools of trade receivables ...................... $995 $ 911
Interest sold to third parties ............................. (500) (500)
--------------------------------------------------------------------------------
Retained interest .......................................... $495 $ 411
================================================================================
Losses on sales of receivables were $7, $10 and $22 million in 2003, 2002 and
2001, respectively. No credit losses were incurred during those years.
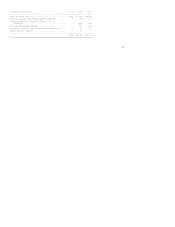
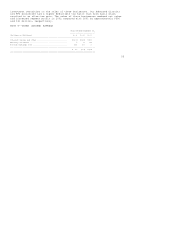
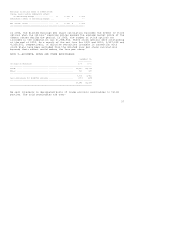
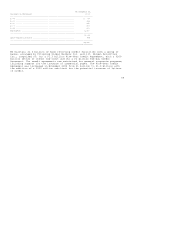
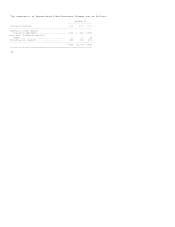
NOTE 10--INVENTORIES
December 31,
---------------
(Dollars in Millions) 2003 2002
--------------------------------------------------------------------------------
Raw materials .............................................. $ 972 $ 936
Work in process ............................................ 802 804
Finished products .......................................... 1,311 1,361
--------------------------------------------------------------------------------
3,085 3,101
Less--Progress payments .................................... (20) (28)
--Reduction to LIFO cost basis ......................... (126) (120)
--------------------------------------------------------------------------------
$2,939 $2,953
================================================================================
Inventories valued at LIFO amounted to $144 and $146 million at December 31,
2003 and 2002, respectively. Had such LIFO inventories been valued at current
costs, their carrying values would have been approximately $126 and $120 million
higher at December 31, 2003 and 2002, respectively.
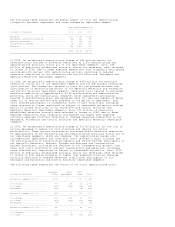
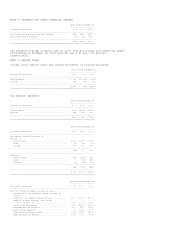
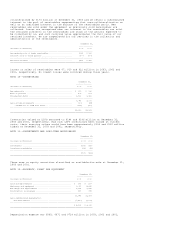
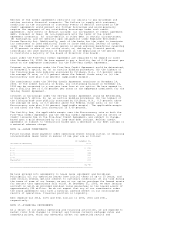
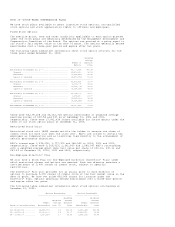
NOTE 11--INVESTMENTS AND LONG-TERM RECEIVABLES
December 31,
------------
(Dollars in Millions) 2003 2002
--------------------------------------------------------------------------------
Investments ..................................................... $181 $160
Long-term receivables ........................................... 388 464
--------------------------------------------------------------------------------
$569 $624
================================================================================
There were no equity securities classified as available-for-sale at December 31,
2003 and 2002.
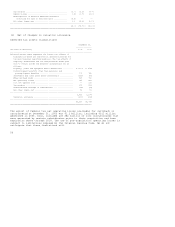
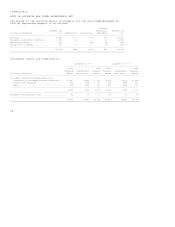
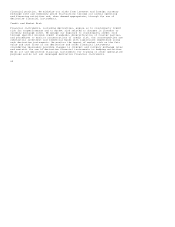
NOTE 12--PROPERTY, PLANT AND EQUIPMENT
December 31,
---------------
(Dollars in Millions) 2003 2002
--------------------------------------------------------------------------------
Land and improvements ..................................... $ 335 $ 297
Machinery and equipment ................................... 9,011 8,646
Buildings and improvements ................................ 1,964 1,836
Construction in progress .................................. 435 378
--------------------------------------------------------------------------------
11,745 11,157
Less--Accumulated depreciation
and amortization ....................................... (7,450) (7,102)
--------------------------------------------------------------------------------
$ 4,295 $ 4,055
================================================================================
Depreciation expense was $595, $671 and $724 million in 2003, 2002 and 2001,