Honeywell 2003 Annual Report Download - page 328
Download and view the complete annual report
Please find page 328 of the 2003 Honeywell annual report below. You can navigate through the pages in the report by either clicking on the pages listed below, or by using the keyword search tool below to find specific information within the annual report.-
 1
1 -
2
-
3
-
4
-
5
-
6
-
7
-
8
-
9
-
10
-
11
-
12
-
13
-
14
-
15
-
16
-
17
-
18
-
19
-
20
-
21
-
22
-
23
-
24
-
25
-
26
-
27
-
28
-
29
-
30
-
31
-
32
-
33
-
34
-
35
-
36
-
37
-
38
-
39
-
40
-
41
-
42
-
43
-
44
-
45
-
46
-
47
-
48
-
49
-
50
-
51
-
52
-
53
-
54
-
55
-
56
-
57
-
58
-
59
-
60
-
61
-
62
-
63
-
64
-
65
-
66
-
67
-
68
-
69
-
70
-
71
-
72
-
73
-
74
-
75
-
76
-
77
-
78
-
79
-
80
-
81
-
82
-
83
-
84
-
85
-
86
-
87
-
88
-
89
-
90
-
91
-
92
-
93
-
94
-
95
-
96
-
97
-
98
-
99
-
100
-
101
-
102
-
103
-
104
-
105
-
106
-
107
-
108
-
109
-
110
-
111
-
112
-
113
-
114
-
115
-
116
-
117
-
118
-
119
-
120
-
121
-
122
-
123
-
124
-
125
-
126
-
127
-
128
-
129
-
130
-
131
-
132
-
133
-
134
-
135
-
136
-
137
-
138
-
139
-
140
-
141
-
142
-
143
-
144
-
145
-
146
-
147
-
148
-
149
-
150
-
151
-
152
-
153
-
154
-
155
-
156
-
157
-
158
-
159
-
160
-
161
-
162
-
163
-
164
-
165
-
166
-
167
-
168
-
169
-
170
-
171
-
172
-
173
-
174
-
175
-
176
-
177
-
178
-
179
-
180
-
181
-
182
-
183
-
184
-
185
-
186
-
187
-
188
-
189
-
190
-
191
-
192
-
193
-
194
-
195
-
196
-
197
-
198
-
199
-
200
-
201
-
202
-
203
-
204
-
205
-
206
-
207
-
208
-
209
-
210
-
211
-
212
-
213
-
214
-
215
-
216
-
217
-
218
-
219
-
220
-
221
-
222
-
223
-
224
-
225
-
226
-
227
-
228
-
229
-
230
-
231
-
232
-
233
-
234
-
235
-
236
-
237
-
238
-
239
-
240
-
241
-
242
-
243
-
244
-
245
-
246
-
247
-
248
-
249
-
250
-
251
-
252
-
253
-
254
-
255
-
256
-
257
-
258
-
259
-
260
-
261
-
262
-
263
-
264
-
265
-
266
-
267
-
268
-
269
-
270
-
271
-
272
-
273
-
274
-
275
-
276
-
277
-
278
-
279
-
280
-
281
-
282
-
283
-
284
-
285
-
286
-
287
-
288
-
289
-
290
-
291
-
292
-
293
-
294
-
295
-
296
-
297
-
298
-
299
-
300
-
301
-
302
-
303
-
304
-
305
-
306
-
307
-
308
-
309
-
310
-
311
-
312
-
313
-
314
-
315
-
316
-
317
-
 318
318 -
 319
319 -
 320
320 -
 321
321 -
 322
322 -
 323
323 -
 324
324 -
 325
325 -
 326
326 -
 327
327 -
 328
328 -
 329
329 -
 330
330 -
 331
331 -
 332
332 -
 333
333 -
 334
334 -
 335
335 -
 336
336 -
 337
337 -
 338
338 -
339
-
340
-
341
-
342
-
343
-
344
-
345
-
346
-
347
-
348
-
349
-
350
-
351
-
352
-
353
-
354
-
355
-
356
-
357
-
358
-
359
-
360
-
361
-
362
-
363
-
364
-
365
-
366
-
367
-
368
-
369
-
370
-
371
-
372
-
373
-
374
-
375
-
376
-
377
-
378
-
379
-
380
-
381
-
382
-
383
-
384
-
385
-
386
-
387
-
388
-
389
-
390
-
391
-
392
-
393
-
394
-
395
-
396
-
397
-
398
-
399
-
400
-
401
-
402
-
403
-
404
-
405
-
406
-
407
-
408
-
409
-
410
-
411
-
412
-
413
-
414
-
415
-
416
-
417
-
418
-
419
-
420
-
421
-
422
-
423
-
424
-
425
-
426
-
427
-
428
-
429
-
430
-
431
-
432
-
433
-
434
-
435
-
436
-
437
-
438
-
439
-
440
-
441
-
442
-
443
-
444
 |
 |
MANAGEMENT'S DISCUSSION AND ANALYSIS Honeywell International Inc.
BUSINESS OVERVIEW
The Financial Section of Honeywell's 2003 Annual Report consists of Management's
Discussion and Analysis (MD&A) of Honeywell's critical accounting policies,
results of operations, financial position, liquidity and capital resources and
legal matters, as well as our Consolidated Financial Statements and related
notes thereto. This Business Overview provides a summary of Honeywell's four
reportable operating segments (Aerospace, Automation and Control Solutions,
Specialty Materials and Transportation Systems), including how they make money,
the relevant economic and other factors impacting their results, and business
challenges and areas of focus in both the short- and long-term. Each of these
segments is comprised of various business units and product classes that serve
multiple end markets. See Note 23 of Notes to Financial Statements for further
information on our reportable segments and our definition of segment profit.
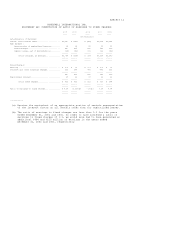
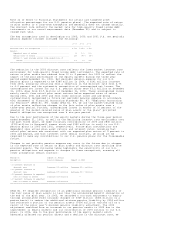
AEROSPACE
(Dollars in Millions) 2003 2002 2001
-------------------------------------------------------------------------------
Net sales .......................................... $8,813 $8,855 $9,653
Segment profit ..................................... $1,221 $1,308 $1,599
Segment profit % ................................... 13.9% 14.8% 16.6%
===============================================================================
Aerospace is a leading global supplier of aircraft engines, avionics, and
related products and services for commercial airlines, business and regional
aircraft, manned and unmanned military aircraft, and spacecraft. Our Aerospace
portfolio includes Engines, Systems and Services (auxiliary power units;
propulsion engines; environmental control systems; engine controls; repair and
overhaul services; hardware; logistics and power generation systems); Aerospace
Electronic Systems (flight safety communications, navigation, radar and
surveillance systems; aircraft and airport lighting; management and technical
services and advanced systems and instruments); and Aircraft Landing Systems
(aircraft wheels and brakes). Aerospace sells its products to original equipment
(OE) manufacturers in the commercial air transport (Airbus and Boeing) and
business and regional (Bombardier, Dassault, Embraer, and Gulfstream) aircraft
segments, as well as spare parts into the aftermarket (principally to aircraft
operators). The United States Government is also a major customer for our space
and defense products.
Economic and Other Factors
Aerospace's operating results are principally driven by the global demand for
air travel as reflected in new aircraft orders, as well as spare parts and
maintenance and repair services for aircraft currently in use. Aircraft orders
by commercial air transport OE manufacturers, business and regional jet
deliveries, as well as global flying hours and airline profitability are the
principal factors that drive our commercial aerospace operating results. U.S.
Government appropriations for defense and space programs and military activity
are critical factors impacting our defense and space operating results.
Business Challenges/Areas of Focus
Aerospace's primary business challenges and areas of focus include:
o Continuing to grow the sales and profitability of the commercial aerospace
aftermarket as the worldwide airline industry struggles to regain and
maintain profitable operations.
o Securing Honeywell product content on new Airbus and Boeing aircraft
platforms.
o Expanding our knowledge management systems into crucial new technologies,
such as predictive monitoring and automatic diagnosis of aircraft engines
and utility systems, further integration of in-flight and on-ground safety
features for aircraft and airports, and high-bandwidth wireless connections
from ground and satellite networks.
o Continuing to design equipment that enhances the safety, performance and
durability of aircraft, while reducing weight and operating costs.
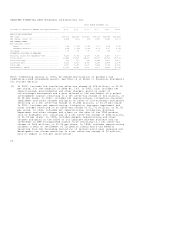
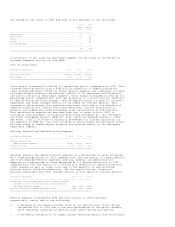
AUTOMATION AND CONTROL SOLUTIONS (ACS)
(Dollars in Millions) 2003 2002 2001
-------------------------------------------------------------------------------
Net sales .......................................... $7,464 $6,978 $7,185
Segment profit ..................................... $ 843 $ 860 $ 774
Segment profit % ................................... 11.3% 12.3% 10.8%
===============================================================================