Honeywell 2003 Annual Report Download - page 379
Download and view the complete annual report
Please find page 379 of the 2003 Honeywell annual report below. You can navigate through the pages in the report by either clicking on the pages listed below, or by using the keyword search tool below to find specific information within the annual report.-
 1
1 -
2
-
3
-
4
-
5
-
6
-
7
-
8
-
9
-
10
-
11
-
12
-
13
-
14
-
15
-
16
-
17
-
18
-
19
-
20
-
21
-
22
-
23
-
24
-
25
-
26
-
27
-
28
-
29
-
30
-
31
-
32
-
33
-
34
-
35
-
36
-
37
-
38
-
39
-
40
-
41
-
42
-
43
-
44
-
45
-
46
-
47
-
48
-
49
-
50
-
51
-
52
-
53
-
54
-
55
-
56
-
57
-
58
-
59
-
60
-
61
-
62
-
63
-
64
-
65
-
66
-
67
-
68
-
69
-
70
-
71
-
72
-
73
-
74
-
75
-
76
-
77
-
78
-
79
-
80
-
81
-
82
-
83
-
84
-
85
-
86
-
87
-
88
-
89
-
90
-
91
-
92
-
93
-
94
-
95
-
96
-
97
-
98
-
99
-
100
-
101
-
102
-
103
-
104
-
105
-
106
-
107
-
108
-
109
-
110
-
111
-
112
-
113
-
114
-
115
-
116
-
117
-
118
-
119
-
120
-
121
-
122
-
123
-
124
-
125
-
126
-
127
-
128
-
129
-
130
-
131
-
132
-
133
-
134
-
135
-
136
-
137
-
138
-
139
-
140
-
141
-
142
-
143
-
144
-
145
-
146
-
147
-
148
-
149
-
150
-
151
-
152
-
153
-
154
-
155
-
156
-
157
-
158
-
159
-
160
-
161
-
162
-
163
-
164
-
165
-
166
-
167
-
168
-
169
-
170
-
171
-
172
-
173
-
174
-
175
-
176
-
177
-
178
-
179
-
180
-
181
-
182
-
183
-
184
-
185
-
186
-
187
-
188
-
189
-
190
-
191
-
192
-
193
-
194
-
195
-
196
-
197
-
198
-
199
-
200
-
201
-
202
-
203
-
204
-
205
-
206
-
207
-
208
-
209
-
210
-
211
-
212
-
213
-
214
-
215
-
216
-
217
-
218
-
219
-
220
-
221
-
222
-
223
-
224
-
225
-
226
-
227
-
228
-
229
-
230
-
231
-
232
-
233
-
234
-
235
-
236
-
237
-
238
-
239
-
240
-
241
-
242
-
243
-
244
-
245
-
246
-
247
-
248
-
249
-
250
-
251
-
252
-
253
-
254
-
255
-
256
-
257
-
258
-
259
-
260
-
261
-
262
-
263
-
264
-
265
-
266
-
267
-
268
-
269
-
270
-
271
-
272
-
273
-
274
-
275
-
276
-
277
-
278
-
279
-
280
-
281
-
282
-
283
-
284
-
285
-
286
-
287
-
288
-
289
-
290
-
291
-
292
-
293
-
294
-
295
-
296
-
297
-
298
-
299
-
300
-
301
-
302
-
303
-
304
-
305
-
306
-
307
-
308
-
309
-
310
-
311
-
312
-
313
-
314
-
315
-
316
-
317
-
318
-
319
-
320
-
321
-
322
-
323
-
324
-
325
-
326
-
327
-
328
-
329
-
330
-
331
-
332
-
333
-
334
-
335
-
336
-
337
-
338
-
339
-
340
-
341
-
342
-
343
-
344
-
345
-
346
-
347
-
348
-
349
-
350
-
351
-
352
-
353
-
354
-
355
-
356
-
357
-
358
-
359
-
360
-
361
-
362
-
363
-
364
-
365
-
366
-
367
-
368
-
 369
369 -
 370
370 -
 371
371 -
 372
372 -
 373
373 -
 374
374 -
 375
375 -
 376
376 -
 377
377 -
 378
378 -
 379
379 -
 380
380 -
 381
381 -
 382
382 -
 383
383 -
 384
384 -
 385
385 -
 386
386 -
 387
387 -
 388
388 -
 389
389 -
390
-
391
-
392
-
393
-
394
-
395
-
396
-
397
-
398
-
399
-
400
-
401
-
402
-
403
-
404
-
405
-
406
-
407
-
408
-
409
-
410
-
411
-
412
-
413
-
414
-
415
-
416
-
417
-
418
-
419
-
420
-
421
-
422
-
423
-
424
-
425
-
426
-
427
-
428
-
429
-
430
-
431
-
432
-
433
-
434
-
435
-
436
-
437
-
438
-
439
-
440
-
441
-
442
-
443
-
444
 |
 |
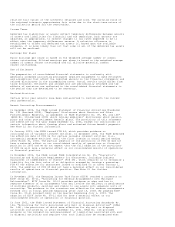
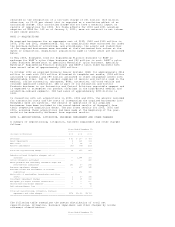
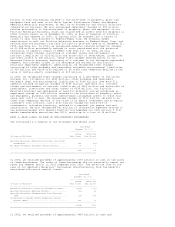
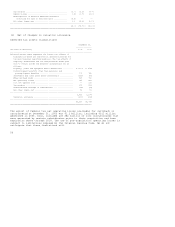
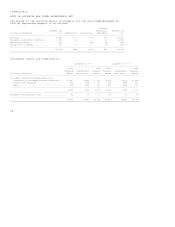
The following table summarizes the pretax impact of total net repositioning,
litigation, business impairment and other charges by reportable segment.
Years Ended December 31,
------------------------
(Dollars in Millions) 2003 2002 2001
--------------------------------------------------------------------------------
Aerospace ........................................... $ 10 $ 146 $ 895
Automation and Control Solutions .................... (22) 212 785
Specialty Materials ................................. 20 976 242
Transportation Systems .............................. 16 295 367
Corporate ........................................... 254 1,430 506
--------------------------------------------------------------------------------
$278 $3,059 $2,795
================================================================================
In 2003, we recognized a repositioning charge of $82 million mainly for
severance costs related to workforce reductions of 1,501 manufacturing and
administrative positions across all of our reportable segments. Also, $69
million of previously established accruals, mainly for severance, were returned
to income in 2003, due to fewer employee separations than originally anticipated
associated with certain 2002 repositioning actions, resulting in reduced
severance liabilities in our Automation and Control Solutions, Aerospace and
Specialty Materials reportable segments.
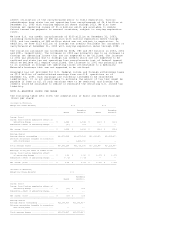
In 2002, we recognized a repositioning charge of $453 million for workforce
reductions across all of our reportable segments and our UOP process technology
joint venture. The charge also related to costs for the planned shutdown and
consolidation of manufacturing plants in our Specialty Materials and Automation
and Control Solutions reportable segments. Severance costs related to announced
workforce reductions of approximately 8,100 manufacturing and administrative
positions, which are substantially complete. Asset impairments principally
related to manufacturing plant and equipment held for sale and capable of being
taken out of service and actively marketed in the period of impairment. Exit
costs related principally to incremental costs to exit facilities, including
lease termination losses negotiated or subject to reasonable estimation related
mainly to closed facilities in our Automation and Control Solutions and
Specialty Materials reportable segments. Also, $76 million of previously
established severance accruals were returned to income in 2002, due to fewer
employee separations than originally anticipated and higher than expected
voluntary employee attrition resulting in reduced severance liabilities in our
Aerospace, Automation and Control Solutions and Specialty Materials reportable
segments.
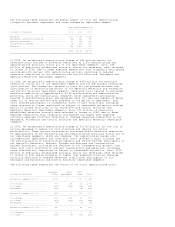
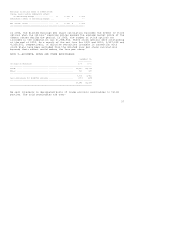
In 2001, we recognized a repositioning charge of $1,016 million for the cost of
actions designed to reduce our cost structure and improve our future
profitability. These actions consisted of announced global workforce reductions
of approximately 20,000 manufacturing and administrative positions across all of
our reportable segments, which are complete. The repositioning charge also
included asset impairments and other exit costs related to plant closures and
the rationalization of manufacturing capacity and infrastructure, principally in
our Specialty Materials, Engines, Systems and Services and Transportation
Systems businesses, including the shutdown of our Turbogenerator product line.
Other exit costs consisted of contract cancellations and penalties, including
lease terminations, negotiated or subject to reasonable estimation. Also, $119
million of previously established accruals, mainly for severance, were returned
to income in 2001 due principally to higher than expected voluntary employee
attrition resulting in reduced severance liabilities, principally in our
Aerospace and Automation and Control Solutions reportable segments.
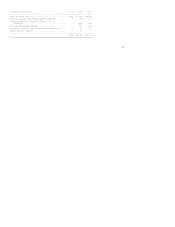
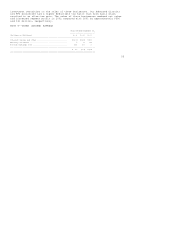
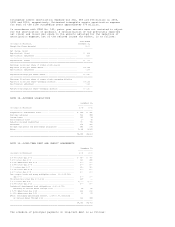
The following table summarizes the status of our total repositioning costs.
Severance Asset Exit
(Dollars in Millions) Costs Impairments Costs Total
--------------------------------------------------------------------------------
Balance at December 31, 2000 ....... $ 236 $ -- $ 80 $ 316
--------------------------------------------------------------------------------
2001 charges ....................... 727 194 95 1,016
2001 usage ......................... (364) (194) (58) (616)
Adjustments ........................ (115) -- (4) (119)
--------------------------------------------------------------------------------
Balance at December 31, 2001 ....... 484 -- 113 597
--------------------------------------------------------------------------------
2002 charges ....................... 270 121 62 453
2002 usage ......................... (355) (121) (92) (568)
Adjustments ........................ (74) -- (2) (76)
--------------------------------------------------------------------------------
Balance at December 31, 2002 ....... 325 -- 81 406
--------------------------------------------------------------------------------
2003 charges ....................... 69 6 7 82
2003 usage ......................... (166) (6) (34) (206)