Honeywell 2003 Annual Report Download - page 348
Download and view the complete annual report
Please find page 348 of the 2003 Honeywell annual report below. You can navigate through the pages in the report by either clicking on the pages listed below, or by using the keyword search tool below to find specific information within the annual report.-
 1
1 -
2
-
3
-
4
-
5
-
6
-
7
-
8
-
9
-
10
-
11
-
12
-
13
-
14
-
15
-
16
-
17
-
18
-
19
-
20
-
21
-
22
-
23
-
24
-
25
-
26
-
27
-
28
-
29
-
30
-
31
-
32
-
33
-
34
-
35
-
36
-
37
-
38
-
39
-
40
-
41
-
42
-
43
-
44
-
45
-
46
-
47
-
48
-
49
-
50
-
51
-
52
-
53
-
54
-
55
-
56
-
57
-
58
-
59
-
60
-
61
-
62
-
63
-
64
-
65
-
66
-
67
-
68
-
69
-
70
-
71
-
72
-
73
-
74
-
75
-
76
-
77
-
78
-
79
-
80
-
81
-
82
-
83
-
84
-
85
-
86
-
87
-
88
-
89
-
90
-
91
-
92
-
93
-
94
-
95
-
96
-
97
-
98
-
99
-
100
-
101
-
102
-
103
-
104
-
105
-
106
-
107
-
108
-
109
-
110
-
111
-
112
-
113
-
114
-
115
-
116
-
117
-
118
-
119
-
120
-
121
-
122
-
123
-
124
-
125
-
126
-
127
-
128
-
129
-
130
-
131
-
132
-
133
-
134
-
135
-
136
-
137
-
138
-
139
-
140
-
141
-
142
-
143
-
144
-
145
-
146
-
147
-
148
-
149
-
150
-
151
-
152
-
153
-
154
-
155
-
156
-
157
-
158
-
159
-
160
-
161
-
162
-
163
-
164
-
165
-
166
-
167
-
168
-
169
-
170
-
171
-
172
-
173
-
174
-
175
-
176
-
177
-
178
-
179
-
180
-
181
-
182
-
183
-
184
-
185
-
186
-
187
-
188
-
189
-
190
-
191
-
192
-
193
-
194
-
195
-
196
-
197
-
198
-
199
-
200
-
201
-
202
-
203
-
204
-
205
-
206
-
207
-
208
-
209
-
210
-
211
-
212
-
213
-
214
-
215
-
216
-
217
-
218
-
219
-
220
-
221
-
222
-
223
-
224
-
225
-
226
-
227
-
228
-
229
-
230
-
231
-
232
-
233
-
234
-
235
-
236
-
237
-
238
-
239
-
240
-
241
-
242
-
243
-
244
-
245
-
246
-
247
-
248
-
249
-
250
-
251
-
252
-
253
-
254
-
255
-
256
-
257
-
258
-
259
-
260
-
261
-
262
-
263
-
264
-
265
-
266
-
267
-
268
-
269
-
270
-
271
-
272
-
273
-
274
-
275
-
276
-
277
-
278
-
279
-
280
-
281
-
282
-
283
-
284
-
285
-
286
-
287
-
288
-
289
-
290
-
291
-
292
-
293
-
294
-
295
-
296
-
297
-
298
-
299
-
300
-
301
-
302
-
303
-
304
-
305
-
306
-
307
-
308
-
309
-
310
-
311
-
312
-
313
-
314
-
315
-
316
-
317
-
318
-
319
-
320
-
321
-
322
-
323
-
324
-
325
-
326
-
327
-
328
-
329
-
330
-
331
-
332
-
333
-
334
-
335
-
336
-
337
-
 338
338 -
 339
339 -
 340
340 -
 341
341 -
 342
342 -
 343
343 -
 344
344 -
 345
345 -
 346
346 -
 347
347 -
 348
348 -
 349
349 -
 350
350 -
 351
351 -
 352
352 -
 353
353 -
 354
354 -
 355
355 -
 356
356 -
 357
357 -
 358
358 -
359
-
360
-
361
-
362
-
363
-
364
-
365
-
366
-
367
-
368
-
369
-
370
-
371
-
372
-
373
-
374
-
375
-
376
-
377
-
378
-
379
-
380
-
381
-
382
-
383
-
384
-
385
-
386
-
387
-
388
-
389
-
390
-
391
-
392
-
393
-
394
-
395
-
396
-
397
-
398
-
399
-
400
-
401
-
402
-
403
-
404
-
405
-
406
-
407
-
408
-
409
-
410
-
411
-
412
-
413
-
414
-
415
-
416
-
417
-
418
-
419
-
420
-
421
-
422
-
423
-
424
-
425
-
426
-
427
-
428
-
429
-
430
-
431
-
432
-
433
-
434
-
435
-
436
-
437
-
438
-
439
-
440
-
441
-
442
-
443
-
444
 |
 |
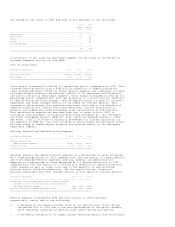
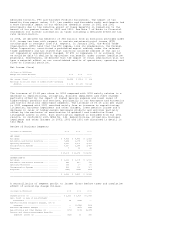
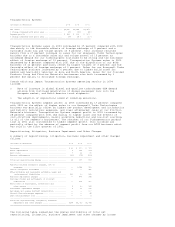
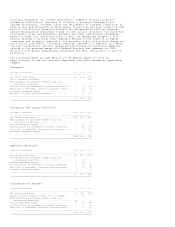
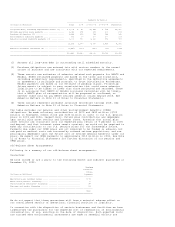
Transportation Systems
(Dollars in Millions) 2003 2002 2001
------------------------------------------------------------------------------
Net sales ........................................ $3,650 $3,184 $3,457
% change compared with prior year ................ 15% (8)% (2)%
Segment profit ................................... $ 461 $ 393 $ 307
% change compared with prior year ................ 17% 28 % 11 %
==============================================================================
Transportation Systems sales in 2003 increased by 15 percent compared with 2002
due mainly to the favorable effects of foreign exchange of 9 percent and a
favorable sales mix and volume growth of 5 percent. This increase resulted
mainly from a 27 percent increase in sales for our Honeywell Turbo Technologies
business due to a favorable sales mix and volume growth of 15 percent as
worldwide demand for our turbochargers continued to be strong and the favorable
effect of foreign exchange of 12 percent. Transportation Systems sales in 2002
decreased by 8 percent compared with 2001 due to the disposition of our BCVS
business of 12 percent partially offset by higher volumes of 3 percent and the
favorable effect of foreign exchange of 2 percent. Sales for our Honeywell Turbo
Technologies business increased by 6 percent due to higher build rates for
medium and heavy-duty vehicles in Asia and North America. Sales for our Consumer
Products Group and Friction Materials businesses also both increased by 2
percent due mainly to favorable foreign exchange.
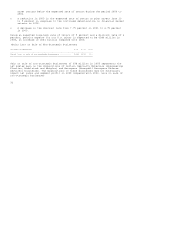
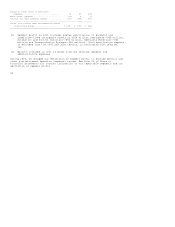
Trends which may impact Transportation Systems operating results in 2004
include:
o Rate of increase in global diesel and gasoline turbocharger OEM demand
arising from continued penetration of diesel passenger cars into the
European market, and North America truck shipments.
o The adoption of regulations aimed at reducing emissions.
Transportation Systems segment profit in 2003 increased by 17 percent compared
with 2002 as the effect of higher sales in our Honeywell Turbo Technologies
business was partially offset by higher new product development and introduction
and facility relocations expenses, and lower aftermarket sales at our Friction
Materials business. Transportation Systems segment profit in 2002 increased by
28 percent compared with 2001 due mainly to higher sales and the effects of
cost-structure improvements, mainly workforce reductions and low-cost sourcing,
in all of the segment's businesses. The shutdown of our Turbogenerator product
line in 2001 also contributed to higher segment profit. This increase was
partially offset by the absence of segment profit from our BCVS business which
was sold in the first quarter of 2002.
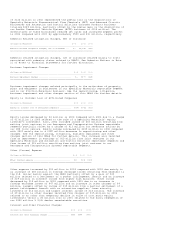
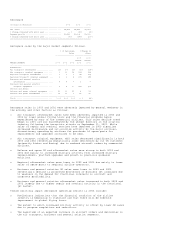
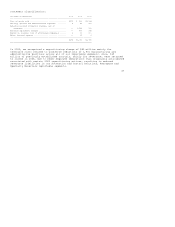
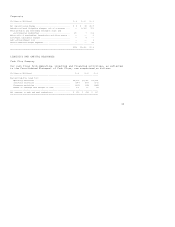
Repositioning, Litigation, Business Impairment and Other Charges
A summary of repositioning, litigation, business impairment and other charges
follows:
(Dollars in Millions) 2003 2002 2001
-------------------------------------------------------------------------------
Severance ............................................ $ 69 $ 270 $ 727
Asset impairments .................................... 6 121 194
Exit costs ........................................... 7 62 95
Reserve adjustments .................................. (69) (76) (119)
-------------------------------------------------------------------------------
Total net repositioning charge ....................... 13 377 897
-------------------------------------------------------------------------------
Asbestos related litigation charges, net of
insurance ......................................... -- 1,548 159
Litton litigation settlement ......................... -- -- 440
Other probable and reasonably estimable legal and
environmental liabilities ........................ 261 30 249
Business impairment charges .......................... -- 877 145
Customer claims and settlements of contract
liabilities ....................................... -- 152 310
Write-offs of receivables, inventories and
other assets ...................................... 2 60 335
Investment impairment charges ........................ 2 15 112
Aerospace jet engine contract cancellation ........... -- -- 100
General Electric merger expenses ..................... -- -- 42
Debt extinguishment loss ............................. -- -- 6
-------------------------------------------------------------------------------
Total net repositioning, litigation, business
impairment and other charges ...................... $278 $3,059 $2,795
===============================================================================
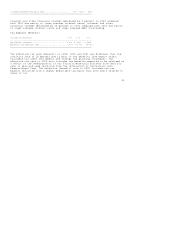
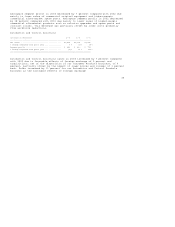
The following table summarizes the pretax distribution of total net
repositioning, litigation, business impairment and other charges by income