Honeywell 2003 Annual Report Download - page 385
Download and view the complete annual report
Please find page 385 of the 2003 Honeywell annual report below. You can navigate through the pages in the report by either clicking on the pages listed below, or by using the keyword search tool below to find specific information within the annual report.-
 1
1 -
2
-
3
-
4
-
5
-
6
-
7
-
8
-
9
-
10
-
11
-
12
-
13
-
14
-
15
-
16
-
17
-
18
-
19
-
20
-
21
-
22
-
23
-
24
-
25
-
26
-
27
-
28
-
29
-
30
-
31
-
32
-
33
-
34
-
35
-
36
-
37
-
38
-
39
-
40
-
41
-
42
-
43
-
44
-
45
-
46
-
47
-
48
-
49
-
50
-
51
-
52
-
53
-
54
-
55
-
56
-
57
-
58
-
59
-
60
-
61
-
62
-
63
-
64
-
65
-
66
-
67
-
68
-
69
-
70
-
71
-
72
-
73
-
74
-
75
-
76
-
77
-
78
-
79
-
80
-
81
-
82
-
83
-
84
-
85
-
86
-
87
-
88
-
89
-
90
-
91
-
92
-
93
-
94
-
95
-
96
-
97
-
98
-
99
-
100
-
101
-
102
-
103
-
104
-
105
-
106
-
107
-
108
-
109
-
110
-
111
-
112
-
113
-
114
-
115
-
116
-
117
-
118
-
119
-
120
-
121
-
122
-
123
-
124
-
125
-
126
-
127
-
128
-
129
-
130
-
131
-
132
-
133
-
134
-
135
-
136
-
137
-
138
-
139
-
140
-
141
-
142
-
143
-
144
-
145
-
146
-
147
-
148
-
149
-
150
-
151
-
152
-
153
-
154
-
155
-
156
-
157
-
158
-
159
-
160
-
161
-
162
-
163
-
164
-
165
-
166
-
167
-
168
-
169
-
170
-
171
-
172
-
173
-
174
-
175
-
176
-
177
-
178
-
179
-
180
-
181
-
182
-
183
-
184
-
185
-
186
-
187
-
188
-
189
-
190
-
191
-
192
-
193
-
194
-
195
-
196
-
197
-
198
-
199
-
200
-
201
-
202
-
203
-
204
-
205
-
206
-
207
-
208
-
209
-
210
-
211
-
212
-
213
-
214
-
215
-
216
-
217
-
218
-
219
-
220
-
221
-
222
-
223
-
224
-
225
-
226
-
227
-
228
-
229
-
230
-
231
-
232
-
233
-
234
-
235
-
236
-
237
-
238
-
239
-
240
-
241
-
242
-
243
-
244
-
245
-
246
-
247
-
248
-
249
-
250
-
251
-
252
-
253
-
254
-
255
-
256
-
257
-
258
-
259
-
260
-
261
-
262
-
263
-
264
-
265
-
266
-
267
-
268
-
269
-
270
-
271
-
272
-
273
-
274
-
275
-
276
-
277
-
278
-
279
-
280
-
281
-
282
-
283
-
284
-
285
-
286
-
287
-
288
-
289
-
290
-
291
-
292
-
293
-
294
-
295
-
296
-
297
-
298
-
299
-
300
-
301
-
302
-
303
-
304
-
305
-
306
-
307
-
308
-
309
-
310
-
311
-
312
-
313
-
314
-
315
-
316
-
317
-
318
-
319
-
320
-
321
-
322
-
323
-
324
-
325
-
326
-
327
-
328
-
329
-
330
-
331
-
332
-
333
-
334
-
335
-
336
-
337
-
338
-
339
-
340
-
341
-
342
-
343
-
344
-
345
-
346
-
347
-
348
-
349
-
350
-
351
-
352
-
353
-
354
-
355
-
356
-
357
-
358
-
359
-
360
-
361
-
362
-
363
-
364
-
365
-
366
-
367
-
368
-
369
-
370
-
371
-
372
-
373
-
374
-
 375
375 -
 376
376 -
 377
377 -
 378
378 -
 379
379 -
 380
380 -
 381
381 -
 382
382 -
 383
383 -
 384
384 -
 385
385 -
 386
386 -
 387
387 -
 388
388 -
 389
389 -
 390
390 -
 391
391 -
 392
392 -
 393
393 -
 394
394 -
 395
395 -
396
-
397
-
398
-
399
-
400
-
401
-
402
-
403
-
404
-
405
-
406
-
407
-
408
-
409
-
410
-
411
-
412
-
413
-
414
-
415
-
416
-
417
-
418
-
419
-
420
-
421
-
422
-
423
-
424
-
425
-
426
-
427
-
428
-
429
-
430
-
431
-
432
-
433
-
434
-
435
-
436
-
437
-
438
-
439
-
440
-
441
-
442
-
443
-
444
 |
 |
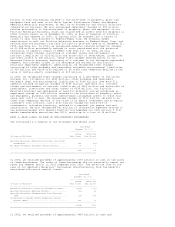
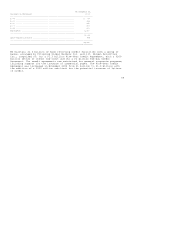
affect utilization of the carryforwards prior to their expiration. Various
subsidiaries have state tax net operating loss carryforwards of $4.4 billion at
December 31, 2003 with varying expiration dates through 2023. We also have
foreign net operating losses of $1.6 billion which are available to reduce
future income tax payments in several countries, subject to varying expiration
rules.
We have U.S. tax credit carryforwards of $160 million at December 31, 2003,
including carryforwards of $80 million with various expiration dates through
2023, and tax credits of $80 million which are not subject to expiration. In
addition, we have $213 million of foreign tax credits available for carryback or
carryforward at December 31, 2003 with varying expiration dates through 2008.
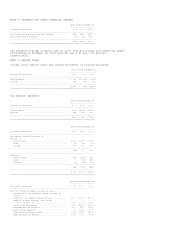
The valuation allowance was increased by $108, $80 and $47 million in 2003, 2002
and 2001, respectively. The increase in 2003 was primarily due to an increase in
foreign net operating losses that are not expected to be utilized. The increase
in 2002 was primarily due to foreign tax credits which are not expected to be
realized and state tax net operating loss carryforwards (net of federal impact)
which we believe will expire unutilized. The increase in 2001 was primarily due
to an increase in foreign net operating losses attributable to a Specialty
Materials business that are not expected to be utilized.
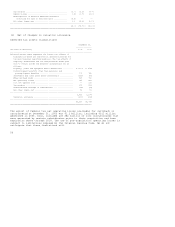
Honeywell has not provided for U.S. federal income and foreign withholding taxes
on $3.3 billion of undistributed earnings from non-U.S. operations as of
December 31, 2003. Such earnings are currently intended to be reinvested
indefinitely. It is not practicable to estimate the amount of tax that might be
payable if some or all of such earnings were to be remitted, and foreign tax
credits would be available to reduce or eliminate the resulting U.S. income tax
liability.
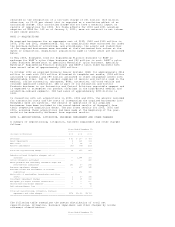
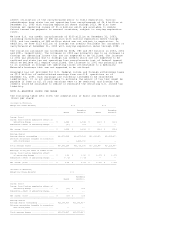
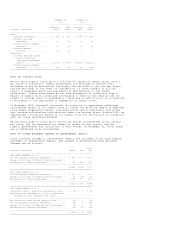
NOTE 8--EARNINGS (LOSS) PER SHARE
The following table sets forth the computations of basic and diluted earnings
(loss) per share:
(Dollars in Millions,
Except Per Share Amounts) 2003 2002
-------------------------------------------------------------------------------------------------------
Assuming Assuming
Basic Dilution Basic Dilution
-------------------------------------------------------------------------------------------------------
Income (loss)
Income (loss) before cumulative effect of
accounting change ..................... $ 1,344 $ 1,344 $ (220) $ (220)
Cumulative effect of accounting change ... (20) (20) -- --
-------------------------------------------------------------------------------------------------------
Net income (loss) ........................ $ 1,324 $ 1,324 $ (220) $ (220)
=======================================================================================================
Average shares
Average shares outstanding ............... 860,671,264 860,671,264 820,292,870 820,292,870
Dilutive securities issuable in connection
with stock plans ...................... -- 1,423,992 -- --
-------------------------------------------------------------------------------------------------------
Total average shares ..................... 860,671,264 862,095,256 820,292,870 820,292,870
=======================================================================================================
Earnings (loss) per share of common stock
Income (loss) before cumulative effect
of accounting change .................. $ 1.56 $ 1.56 $ (0.27) $ (0.27)
Cumulative effect of accounting change ... (0.02) (0.02) -- --
-------------------------------------------------------------------------------------------------------
Net income (loss) ........................ $ 1.54 $ 1.54 $ (0.27) $ (0.27)
=======================================================================================================
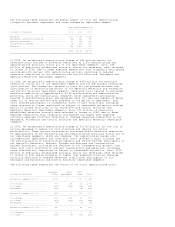
(Dollars in Millions,
Except Per Share Amounts) 2001
------------------------------------------------------------------------
Assuming
Basic Dilution
------------------------------------------------------------------------
Income (loss)
Income (loss) before cumulative effect of
accounting change ..................... $ (99) $ (99)
Cumulative effect of accounting change ... -- --
------------------------------------------------------------------------
Net income (loss) ........................ $ (99) $ (99)
========================================================================
Average shares
Average shares outstanding ............... 812,273,417 812,273,417
Dilutive securities issuable in connection
with stock plans ...................... -- --
------------------------------------------------------------------------
Total average shares ..................... 812,273,417 812,273,417
========================================================================