Honeywell 2003 Annual Report Download - page 415
Download and view the complete annual report
Please find page 415 of the 2003 Honeywell annual report below. You can navigate through the pages in the report by either clicking on the pages listed below, or by using the keyword search tool below to find specific information within the annual report.-
 1
1 -
2
-
3
-
4
-
5
-
6
-
7
-
8
-
9
-
10
-
11
-
12
-
13
-
14
-
15
-
16
-
17
-
18
-
19
-
20
-
21
-
22
-
23
-
24
-
25
-
26
-
27
-
28
-
29
-
30
-
31
-
32
-
33
-
34
-
35
-
36
-
37
-
38
-
39
-
40
-
41
-
42
-
43
-
44
-
45
-
46
-
47
-
48
-
49
-
50
-
51
-
52
-
53
-
54
-
55
-
56
-
57
-
58
-
59
-
60
-
61
-
62
-
63
-
64
-
65
-
66
-
67
-
68
-
69
-
70
-
71
-
72
-
73
-
74
-
75
-
76
-
77
-
78
-
79
-
80
-
81
-
82
-
83
-
84
-
85
-
86
-
87
-
88
-
89
-
90
-
91
-
92
-
93
-
94
-
95
-
96
-
97
-
98
-
99
-
100
-
101
-
102
-
103
-
104
-
105
-
106
-
107
-
108
-
109
-
110
-
111
-
112
-
113
-
114
-
115
-
116
-
117
-
118
-
119
-
120
-
121
-
122
-
123
-
124
-
125
-
126
-
127
-
128
-
129
-
130
-
131
-
132
-
133
-
134
-
135
-
136
-
137
-
138
-
139
-
140
-
141
-
142
-
143
-
144
-
145
-
146
-
147
-
148
-
149
-
150
-
151
-
152
-
153
-
154
-
155
-
156
-
157
-
158
-
159
-
160
-
161
-
162
-
163
-
164
-
165
-
166
-
167
-
168
-
169
-
170
-
171
-
172
-
173
-
174
-
175
-
176
-
177
-
178
-
179
-
180
-
181
-
182
-
183
-
184
-
185
-
186
-
187
-
188
-
189
-
190
-
191
-
192
-
193
-
194
-
195
-
196
-
197
-
198
-
199
-
200
-
201
-
202
-
203
-
204
-
205
-
206
-
207
-
208
-
209
-
210
-
211
-
212
-
213
-
214
-
215
-
216
-
217
-
218
-
219
-
220
-
221
-
222
-
223
-
224
-
225
-
226
-
227
-
228
-
229
-
230
-
231
-
232
-
233
-
234
-
235
-
236
-
237
-
238
-
239
-
240
-
241
-
242
-
243
-
244
-
245
-
246
-
247
-
248
-
249
-
250
-
251
-
252
-
253
-
254
-
255
-
256
-
257
-
258
-
259
-
260
-
261
-
262
-
263
-
264
-
265
-
266
-
267
-
268
-
269
-
270
-
271
-
272
-
273
-
274
-
275
-
276
-
277
-
278
-
279
-
280
-
281
-
282
-
283
-
284
-
285
-
286
-
287
-
288
-
289
-
290
-
291
-
292
-
293
-
294
-
295
-
296
-
297
-
298
-
299
-
300
-
301
-
302
-
303
-
304
-
305
-
306
-
307
-
308
-
309
-
310
-
311
-
312
-
313
-
314
-
315
-
316
-
317
-
318
-
319
-
320
-
321
-
322
-
323
-
324
-
325
-
326
-
327
-
328
-
329
-
330
-
331
-
332
-
333
-
334
-
335
-
336
-
337
-
338
-
339
-
340
-
341
-
342
-
343
-
344
-
345
-
346
-
347
-
348
-
349
-
350
-
351
-
352
-
353
-
354
-
355
-
356
-
357
-
358
-
359
-
360
-
361
-
362
-
363
-
364
-
365
-
366
-
367
-
368
-
369
-
370
-
371
-
372
-
373
-
374
-
375
-
376
-
377
-
378
-
379
-
380
-
381
-
382
-
383
-
384
-
385
-
386
-
387
-
388
-
389
-
390
-
391
-
392
-
393
-
394
-
395
-
396
-
397
-
398
-
399
-
400
-
401
-
402
-
403
-
404
-
 405
405 -
 406
406 -
 407
407 -
 408
408 -
 409
409 -
 410
410 -
 411
411 -
 412
412 -
 413
413 -
 414
414 -
 415
415 -
 416
416 -
 417
417 -
 418
418 -
 419
419 -
 420
420 -
 421
421 -
 422
422 -
 423
423 -
 424
424 -
 425
425 -
426
-
427
-
428
-
429
-
430
-
431
-
432
-
433
-
434
-
435
-
436
-
437
-
438
-
439
-
440
-
441
-
442
-
443
-
444
 |
 |
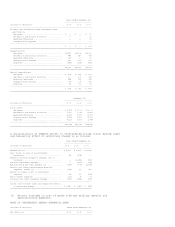
Pension Benefits
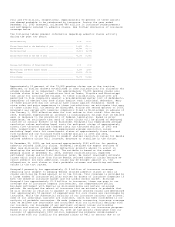
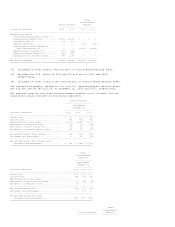
Pension plans with accumulated benefit obligations exceeding the fair value of
plan assets were as follows at December 31, 2003 and 2002:
(Dollars in Millions) 2003 2002
--------------------------------------------------------------------------------
Projected benefit obligation ................................. $1,639 $4,315
Accumulated benefit obligation ............................... 1,566 4,036
Fair value of plan assets .................................... 906 3,109
================================================================================
SFAS No. 87 requires recognition of an additional minimum pension liability if
the fair value of plan assets is less than the accumulated benefit obligation at
the end of the plan year. In 2003, we recorded a non-cash adjustment to equity
through accumulated other nonowner changes of $369 million ($604 million on a
pretax basis) to reduce the additional minimum pension liability by $304 million
and reinstate a portion of the pension assets ($300 million) written off in the
prior year's minimum pension liability adjustment. This 2003 adjustment resulted
from an increase in our pension assets in 2003 due to the improvement in equity
markets and our contribution of $670 million to our U.S. plans. In 2002, due to
the poor performance of the equity markets which adversely affected our pension
assets and a decline in the discount rate, we recorded a non-cash adjustment to
equity through accumulated other nonowner changes of $606 million ($956 million
on a pretax basis) which increased the additional minimum pension liability.
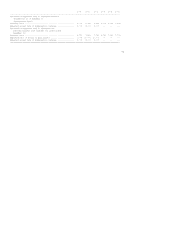
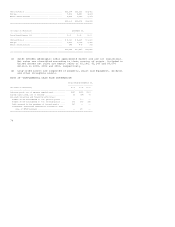
Our U.S. pension plans assets were $10.9 and $9.0 billion at December 31, 2003
and 2002, respectively. Our asset allocation at December 31, 2003 and 2002 and
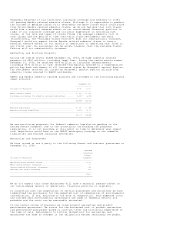
target allocation for our U.S. pension plans assets are as follows:
Percentage of Plans
Assets at
December 31, Long-term
------------------- Target
Asset Category 2003 2002 Allocation
-------------------------------------------------------------------------------
Equity securities .......................... 58% 54% 40-65%
Debt securities, including cash ............ 35 38 30-45
Real estate ................................ 5 5 2-8
Other ...................................... 2 3 2-4
-------------------------------------------------------------------------------
100% 100%
===============================================================================
Equity securities include Honeywell common stock of $544 and $811 million at
December 31, 2003 and 2002, respectively. An independent fiduciary holds and
makes all investment decisions with respect to the Honeywell common stock.
Our asset investment strategy focuses on maintaining a diversified portfolio,
using various asset classes, in order to achieve our long-term investment
objectives on a risk adjusted basis. To achieve our objectives, our investment
policy requires that our U.S. Master Retirement Trust be invested as follows:
(a) no less than 30 percent be invested in fixed income securities; (b) no more
than 10 percent in high-yield securities; (c) no more than 10 percent in private
real estate investments; and (d) no more than 6 percent in other investment
alternatives involving limited partnerships of various types. There is no stated
limit on investments in publically-held U.S. and international equity
securities. Our actual invested positions in various securities changes over
time based on short and longer-term investment opportunities.
Our expected rate of return on plan assets of 9 percent is a long-term rate
based on historic plan asset returns over varying long-term periods combined
with current market conditions and broad asset mix considerations. The expected
rate of return is a long-term assumption and generally does not change annually.
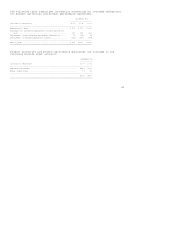
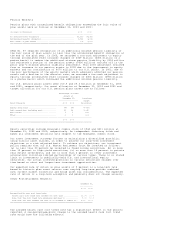
Other Postretirement Benefits
December 31,
------------
2003 2002
--------------------------------------------------------------------------------
Assumed health care cost trend rate:
Health care cost trend rate assumed for next year .............. 11.0% 9.0%
Rate that the cost trend rate gradually declines to ............ 5.0% 5.0%
Year that the rate reaches the rate it is assumed to remain at.. 2010 2007
================================================================================
The assumed health care cost trend rate has a significant effect on the amounts
reported. A one-percentage-point change in the assumed health care cost trend
rate would have the following effects: