Honeywell 2003 Annual Report Download - page 336
Download and view the complete annual report
Please find page 336 of the 2003 Honeywell annual report below. You can navigate through the pages in the report by either clicking on the pages listed below, or by using the keyword search tool below to find specific information within the annual report.-
 1
1 -
2
-
3
-
4
-
5
-
6
-
7
-
8
-
9
-
10
-
11
-
12
-
13
-
14
-
15
-
16
-
17
-
18
-
19
-
20
-
21
-
22
-
23
-
24
-
25
-
26
-
27
-
28
-
29
-
30
-
31
-
32
-
33
-
34
-
35
-
36
-
37
-
38
-
39
-
40
-
41
-
42
-
43
-
44
-
45
-
46
-
47
-
48
-
49
-
50
-
51
-
52
-
53
-
54
-
55
-
56
-
57
-
58
-
59
-
60
-
61
-
62
-
63
-
64
-
65
-
66
-
67
-
68
-
69
-
70
-
71
-
72
-
73
-
74
-
75
-
76
-
77
-
78
-
79
-
80
-
81
-
82
-
83
-
84
-
85
-
86
-
87
-
88
-
89
-
90
-
91
-
92
-
93
-
94
-
95
-
96
-
97
-
98
-
99
-
100
-
101
-
102
-
103
-
104
-
105
-
106
-
107
-
108
-
109
-
110
-
111
-
112
-
113
-
114
-
115
-
116
-
117
-
118
-
119
-
120
-
121
-
122
-
123
-
124
-
125
-
126
-
127
-
128
-
129
-
130
-
131
-
132
-
133
-
134
-
135
-
136
-
137
-
138
-
139
-
140
-
141
-
142
-
143
-
144
-
145
-
146
-
147
-
148
-
149
-
150
-
151
-
152
-
153
-
154
-
155
-
156
-
157
-
158
-
159
-
160
-
161
-
162
-
163
-
164
-
165
-
166
-
167
-
168
-
169
-
170
-
171
-
172
-
173
-
174
-
175
-
176
-
177
-
178
-
179
-
180
-
181
-
182
-
183
-
184
-
185
-
186
-
187
-
188
-
189
-
190
-
191
-
192
-
193
-
194
-
195
-
196
-
197
-
198
-
199
-
200
-
201
-
202
-
203
-
204
-
205
-
206
-
207
-
208
-
209
-
210
-
211
-
212
-
213
-
214
-
215
-
216
-
217
-
218
-
219
-
220
-
221
-
222
-
223
-
224
-
225
-
226
-
227
-
228
-
229
-
230
-
231
-
232
-
233
-
234
-
235
-
236
-
237
-
238
-
239
-
240
-
241
-
242
-
243
-
244
-
245
-
246
-
247
-
248
-
249
-
250
-
251
-
252
-
253
-
254
-
255
-
256
-
257
-
258
-
259
-
260
-
261
-
262
-
263
-
264
-
265
-
266
-
267
-
268
-
269
-
270
-
271
-
272
-
273
-
274
-
275
-
276
-
277
-
278
-
279
-
280
-
281
-
282
-
283
-
284
-
285
-
286
-
287
-
288
-
289
-
290
-
291
-
292
-
293
-
294
-
295
-
296
-
297
-
298
-
299
-
300
-
301
-
302
-
303
-
304
-
305
-
306
-
307
-
308
-
309
-
310
-
311
-
312
-
313
-
314
-
315
-
316
-
317
-
318
-
319
-
320
-
321
-
322
-
323
-
324
-
325
-
 326
326 -
 327
327 -
 328
328 -
 329
329 -
 330
330 -
 331
331 -
 332
332 -
 333
333 -
 334
334 -
 335
335 -
 336
336 -
 337
337 -
 338
338 -
 339
339 -
 340
340 -
 341
341 -
 342
342 -
 343
343 -
 344
344 -
 345
345 -
 346
346 -
347
-
348
-
349
-
350
-
351
-
352
-
353
-
354
-
355
-
356
-
357
-
358
-
359
-
360
-
361
-
362
-
363
-
364
-
365
-
366
-
367
-
368
-
369
-
370
-
371
-
372
-
373
-
374
-
375
-
376
-
377
-
378
-
379
-
380
-
381
-
382
-
383
-
384
-
385
-
386
-
387
-
388
-
389
-
390
-
391
-
392
-
393
-
394
-
395
-
396
-
397
-
398
-
399
-
400
-
401
-
402
-
403
-
404
-
405
-
406
-
407
-
408
-
409
-
410
-
411
-
412
-
413
-
414
-
415
-
416
-
417
-
418
-
419
-
420
-
421
-
422
-
423
-
424
-
425
-
426
-
427
-
428
-
429
-
430
-
431
-
432
-
433
-
434
-
435
-
436
-
437
-
438
-
439
-
440
-
441
-
442
-
443
-
444
 |
 |
able. These events or changes in circumstances include business plans and
forecasts, economic or competitive positions within an industry, as well as
current operating performance and anticipated future performance based on a
business' competitive position. An impairment is assessed when the undiscounted
expected future cash flows derived from an asset are less than its carrying
amount. Impairment losses are measured as the amount by which the carrying value
of a long-lived asset exceeds its fair value and are recognized in earnings. We
continually apply our best judgment when applying the impairment rules to
determine the timing of the impairment test, the undiscounted cash flows used to
assess impairment, and the fair value of an impaired long-lived asset group. The
dynamic economic environment in which each of our businesses operate and the
resulting assumptions used to estimate future cash flows, such as economic
growth rates, industry growth rates, product life cycles, selling price changes
and cost inflation can significantly influence and impact the outcome of all
impairment tests. For a discussion of the result of management's judgment
applied in the recognition and measurement of impairment charges see the
repositioning, litigation, business impairment and other charges section of this
MD&A.
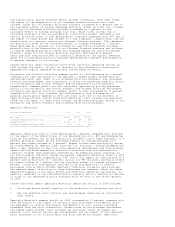
Income Taxes
The future tax benefit arising from net deductible temporary differences and tax
carryforwards was $1.8 and $2.3 billion at December 31, 2003 and 2002,
respectively. We believe that our earnings during the periods when the temporary
differences become deductible will be sufficient to realize the related future
income tax benefits. For those jurisdictions where the expiration date of tax
carryforwards or the projected operating results indicate that realization is
not likely, a valuation allowance is provided.
In assessing the need for a valuation allowance, we consider all available
positive and negative evidence, including past operating results, estimates of
future taxable income and the feasibility of ongoing tax planning strategies.
Significant management judgment is required in determining the provision for
income taxes and, in particular, any valuation allowance recorded against our
deferred tax assets. Additionally, valuation allowances related to deferred tax
assets can be impacted by changes to tax laws and future taxable income levels.
In the event we determine that we will not be able to realize our deferred tax
assets in the future, we will reduce such amounts through a charge to income in
the period that such determination is made. Conversely, if we determine that we
will be able to realize deferred tax assets in excess of the carrying amounts,
we will decrease the recorded valuation allowance through a credit to income in
the period that such determination is made.
Sales Recognition on Long-Term Contracts
In 2003, we recognized approximately 10 percent of our total net sales
using the percentage-of-completion method for long-term contracts in our
Automation and Control Solutions and Aerospace reportable segments. The
percentage-of-completion method requires us to make judgments in estimating
contract revenues, contract costs and progress toward completion. These
judgments form the basis for our determinations regarding overall contract
value, contract profitability and timing of revenue recognition based on
measured progress toward contract completion. Revenue and cost estimates are
monitored on an ongoing basis and revised based on changes in circumstances.
Anticipated losses on long-term contracts are recognized when such losses become
evident. We maintain financial controls over the customer qualification,
contract pricing and cost estimation processes to reduce the risk of contract
losses.
Aerospace Customer Incentives
Consistent with most suppliers to commercial aircraft manufacturers and
airlines, we offer sales incentives to commercial aircraft manufacturers and
airlines in connection with their selection of our products for installation on
commercial aircraft. These incentives may consist of free products, credits,
discounts or upfront cash payments. The cost of these incentives is recognized
in the period incurred unless the incentive is subject to recovery through a
long-term product maintenance requirement mandated by the Federal Aviation
Administration for certified replacement equipment and service. Amounts
capitalized at December 31, 2003, 2002 and 2001 were $719, $662, and $607
million, respectively, and are being recognized over the estimated minimum
service life of the aircraft (up to 25 years) as a reduction in future sales or
an increase in cost of goods sold based on the type of incentive granted. We
routinely evaluate the recoverability of capitalized amounts based on forecasted
replacement equipment sales over the estimated minimum life of the aircraft
considering estimated aircraft flight hours, number of landings, as well as
actual aircraft retirements. For additional information see Notes 1 and 13 of
Notes to Financial Statements.
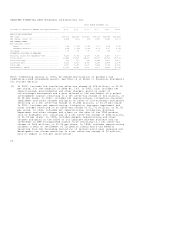
RESULTS OF OPERATIONS
Net Sales