Honeywell 2003 Annual Report Download - page 334
Download and view the complete annual report
Please find page 334 of the 2003 Honeywell annual report below. You can navigate through the pages in the report by either clicking on the pages listed below, or by using the keyword search tool below to find specific information within the annual report.-
 1
1 -
2
-
3
-
4
-
5
-
6
-
7
-
8
-
9
-
10
-
11
-
12
-
13
-
14
-
15
-
16
-
17
-
18
-
19
-
20
-
21
-
22
-
23
-
24
-
25
-
26
-
27
-
28
-
29
-
30
-
31
-
32
-
33
-
34
-
35
-
36
-
37
-
38
-
39
-
40
-
41
-
42
-
43
-
44
-
45
-
46
-
47
-
48
-
49
-
50
-
51
-
52
-
53
-
54
-
55
-
56
-
57
-
58
-
59
-
60
-
61
-
62
-
63
-
64
-
65
-
66
-
67
-
68
-
69
-
70
-
71
-
72
-
73
-
74
-
75
-
76
-
77
-
78
-
79
-
80
-
81
-
82
-
83
-
84
-
85
-
86
-
87
-
88
-
89
-
90
-
91
-
92
-
93
-
94
-
95
-
96
-
97
-
98
-
99
-
100
-
101
-
102
-
103
-
104
-
105
-
106
-
107
-
108
-
109
-
110
-
111
-
112
-
113
-
114
-
115
-
116
-
117
-
118
-
119
-
120
-
121
-
122
-
123
-
124
-
125
-
126
-
127
-
128
-
129
-
130
-
131
-
132
-
133
-
134
-
135
-
136
-
137
-
138
-
139
-
140
-
141
-
142
-
143
-
144
-
145
-
146
-
147
-
148
-
149
-
150
-
151
-
152
-
153
-
154
-
155
-
156
-
157
-
158
-
159
-
160
-
161
-
162
-
163
-
164
-
165
-
166
-
167
-
168
-
169
-
170
-
171
-
172
-
173
-
174
-
175
-
176
-
177
-
178
-
179
-
180
-
181
-
182
-
183
-
184
-
185
-
186
-
187
-
188
-
189
-
190
-
191
-
192
-
193
-
194
-
195
-
196
-
197
-
198
-
199
-
200
-
201
-
202
-
203
-
204
-
205
-
206
-
207
-
208
-
209
-
210
-
211
-
212
-
213
-
214
-
215
-
216
-
217
-
218
-
219
-
220
-
221
-
222
-
223
-
224
-
225
-
226
-
227
-
228
-
229
-
230
-
231
-
232
-
233
-
234
-
235
-
236
-
237
-
238
-
239
-
240
-
241
-
242
-
243
-
244
-
245
-
246
-
247
-
248
-
249
-
250
-
251
-
252
-
253
-
254
-
255
-
256
-
257
-
258
-
259
-
260
-
261
-
262
-
263
-
264
-
265
-
266
-
267
-
268
-
269
-
270
-
271
-
272
-
273
-
274
-
275
-
276
-
277
-
278
-
279
-
280
-
281
-
282
-
283
-
284
-
285
-
286
-
287
-
288
-
289
-
290
-
291
-
292
-
293
-
294
-
295
-
296
-
297
-
298
-
299
-
300
-
301
-
302
-
303
-
304
-
305
-
306
-
307
-
308
-
309
-
310
-
311
-
312
-
313
-
314
-
315
-
316
-
317
-
318
-
319
-
320
-
321
-
322
-
323
-
 324
324 -
 325
325 -
 326
326 -
 327
327 -
 328
328 -
 329
329 -
 330
330 -
 331
331 -
 332
332 -
 333
333 -
 334
334 -
 335
335 -
 336
336 -
 337
337 -
 338
338 -
 339
339 -
 340
340 -
 341
341 -
 342
342 -
 343
343 -
 344
344 -
345
-
346
-
347
-
348
-
349
-
350
-
351
-
352
-
353
-
354
-
355
-
356
-
357
-
358
-
359
-
360
-
361
-
362
-
363
-
364
-
365
-
366
-
367
-
368
-
369
-
370
-
371
-
372
-
373
-
374
-
375
-
376
-
377
-
378
-
379
-
380
-
381
-
382
-
383
-
384
-
385
-
386
-
387
-
388
-
389
-
390
-
391
-
392
-
393
-
394
-
395
-
396
-
397
-
398
-
399
-
400
-
401
-
402
-
403
-
404
-
405
-
406
-
407
-
408
-
409
-
410
-
411
-
412
-
413
-
414
-
415
-
416
-
417
-
418
-
419
-
420
-
421
-
422
-
423
-
424
-
425
-
426
-
427
-
428
-
429
-
430
-
431
-
432
-
433
-
434
-
435
-
436
-
437
-
438
-
439
-
440
-
441
-
442
-
443
-
444
 |
 |
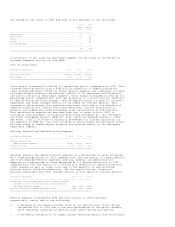
Note 22 of Notes to Financial Statements for actual and targeted asset
allocation percentages for our U.S. pension plans). The expected rate of return
on plan assets is a long-term assumption and generally does not change annually.
The discount rate reflects the market rate for high-quality fixed income debt
instruments on our annual measurement date (December 31) and is subject to
change each year.
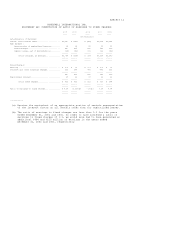
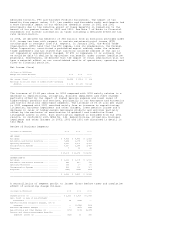
The key assumptions used in developing our 2003, 2002 and 2001 U.S. net periodic
pension expense (income) included the following:
2003 2002 2001
------------------------------------------------------------------------------
Discount rate for obligations ........................... 6.75% 7.25% 7.75%
Assets:
Expected rate of return .............................. 9% 10% 10%
Actual rate of return ................................ 23% (8)% (3)%
Actual 10 year average annual compounded rate of
return ............................................ 10% 9% 11%
==============================================================================
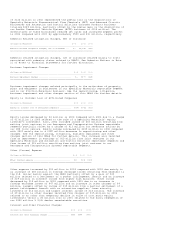
The reduction in the 2003 discount rate reflects the lower market interest rate
environment for high-quality fixed income debt instruments. The expected rate of
return on plan assets was reduced from 10 to 9 percent for 2003 to reflect the
impact of the poor performance of the equity markets during the three year
period ended December 31, 2002. Net periodic pension expense for our U.S.
pension plans is expected to be $380 million in 2004, a $241 million increase
from 2003, primarily resulting from a reduction in the discount rate from 6.75
to 6.0 percent and the systematic recognition of unrecognized net losses. The
unrecognized net losses for our U.S. pension plans were $3.2 billion at December
31, 2003, down from $3.5 billion at December 31, 2002. These unrecognized losses
mainly result from actual plan asset returns below expected rates of return
during 2002, 2001 and 2000 and from lower discount rates and are being
systematically recognized in future net periodic pension expense in accordance
with Statement of Financial Accounting Standards No. 87, "Employers Accounting
for Pensions" (SFAS No. 87). Under SFAS No. 87, we use the market-related value
of plan assets reflecting changes in the fair value of plan assets over a
three-year period. Further, unrecognized losses in excess of 10 percent of the
greater of the market-related value of plan assets or the plans' projected
benefit obligation are recognized over a six-year period.
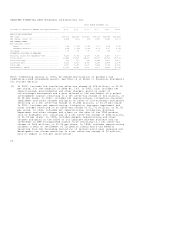
Due to the poor performance of the equity markets during the three-year period
ended December 31, 2002, as well as the declining interest rate environment over
the past three years, we made voluntary contributions of $670 and $830 million
($700 million in Honeywell common stock and $130 million in cash) to our U.S.
pension plans in 2003 and 2002, respectively. Future plan contributions are
dependent upon actual plan asset returns and interest rates. Assuming that
actual plan returns are consistent with our expected plan return of 9 percent in
2004 and beyond, and that interest rates remain constant, we would not be
required to make any contributions to our U.S. pension plans for the foreseeable
future.
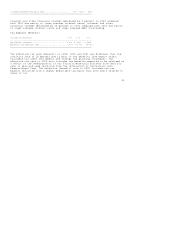
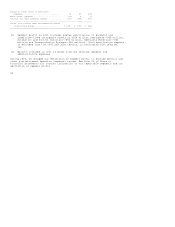
Changes in net periodic pension expense may occur in the future due to changes
in our expected rate of return on plan assets and discount rate resulting from
economic events. The following table highlights the sensitivity of our U.S.
pension obligations and expense to changes in these assumptions, assuming all
other assumptions remain constant:
Change in Impact on Annual
Assumption Pension Expense Impact on PBO
--------------------------------------------------------------------------------
0.25 percent decrease in
discount rate Increase $50 million Increase $300 million
0.25 percent increase in
discount rate Decrease $50 million Decrease $300 million
0.25 percent decrease in expected
rate of return on assets Increase $25 million --
0.25 percent increase in expected
rate of return on assets Decrease $25 million --
================================================================================
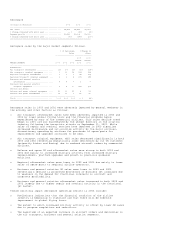
SFAS No. 87 requires recognition of an additional minimum pension liability if
the fair value of plan assets is less than the accumulated benefit obligation at
the end of the plan year. In 2003, we recorded a non-cash adjustment to equity
through accumulated other nonowner changes of $369 million ($604 million on a
pretax basis) to reduce the additional minimum pension liability by $304 million
and reinstate a portion of our pension assets ($300 million) written off as a
result of the prior year's minimum pension liability adjustment. The 2003
adjustment resulted from an increase in our pension assets in 2003 due to the
improvement in equity markets and our contribution of $670 million to our U.S.
plans. In 2002, due to the poor performance of the equity markets which
adversely affected our pension assets and a decline in the discount rate, we