Honeywell 2003 Annual Report Download - page 362
Download and view the complete annual report
Please find page 362 of the 2003 Honeywell annual report below. You can navigate through the pages in the report by either clicking on the pages listed below, or by using the keyword search tool below to find specific information within the annual report.-
 1
1 -
2
-
3
-
4
-
5
-
6
-
7
-
8
-
9
-
10
-
11
-
12
-
13
-
14
-
15
-
16
-
17
-
18
-
19
-
20
-
21
-
22
-
23
-
24
-
25
-
26
-
27
-
28
-
29
-
30
-
31
-
32
-
33
-
34
-
35
-
36
-
37
-
38
-
39
-
40
-
41
-
42
-
43
-
44
-
45
-
46
-
47
-
48
-
49
-
50
-
51
-
52
-
53
-
54
-
55
-
56
-
57
-
58
-
59
-
60
-
61
-
62
-
63
-
64
-
65
-
66
-
67
-
68
-
69
-
70
-
71
-
72
-
73
-
74
-
75
-
76
-
77
-
78
-
79
-
80
-
81
-
82
-
83
-
84
-
85
-
86
-
87
-
88
-
89
-
90
-
91
-
92
-
93
-
94
-
95
-
96
-
97
-
98
-
99
-
100
-
101
-
102
-
103
-
104
-
105
-
106
-
107
-
108
-
109
-
110
-
111
-
112
-
113
-
114
-
115
-
116
-
117
-
118
-
119
-
120
-
121
-
122
-
123
-
124
-
125
-
126
-
127
-
128
-
129
-
130
-
131
-
132
-
133
-
134
-
135
-
136
-
137
-
138
-
139
-
140
-
141
-
142
-
143
-
144
-
145
-
146
-
147
-
148
-
149
-
150
-
151
-
152
-
153
-
154
-
155
-
156
-
157
-
158
-
159
-
160
-
161
-
162
-
163
-
164
-
165
-
166
-
167
-
168
-
169
-
170
-
171
-
172
-
173
-
174
-
175
-
176
-
177
-
178
-
179
-
180
-
181
-
182
-
183
-
184
-
185
-
186
-
187
-
188
-
189
-
190
-
191
-
192
-
193
-
194
-
195
-
196
-
197
-
198
-
199
-
200
-
201
-
202
-
203
-
204
-
205
-
206
-
207
-
208
-
209
-
210
-
211
-
212
-
213
-
214
-
215
-
216
-
217
-
218
-
219
-
220
-
221
-
222
-
223
-
224
-
225
-
226
-
227
-
228
-
229
-
230
-
231
-
232
-
233
-
234
-
235
-
236
-
237
-
238
-
239
-
240
-
241
-
242
-
243
-
244
-
245
-
246
-
247
-
248
-
249
-
250
-
251
-
252
-
253
-
254
-
255
-
256
-
257
-
258
-
259
-
260
-
261
-
262
-
263
-
264
-
265
-
266
-
267
-
268
-
269
-
270
-
271
-
272
-
273
-
274
-
275
-
276
-
277
-
278
-
279
-
280
-
281
-
282
-
283
-
284
-
285
-
286
-
287
-
288
-
289
-
290
-
291
-
292
-
293
-
294
-
295
-
296
-
297
-
298
-
299
-
300
-
301
-
302
-
303
-
304
-
305
-
306
-
307
-
308
-
309
-
310
-
311
-
312
-
313
-
314
-
315
-
316
-
317
-
318
-
319
-
320
-
321
-
322
-
323
-
324
-
325
-
326
-
327
-
328
-
329
-
330
-
331
-
332
-
333
-
334
-
335
-
336
-
337
-
338
-
339
-
340
-
341
-
342
-
343
-
344
-
345
-
346
-
347
-
348
-
349
-
350
-
351
-
 352
352 -
 353
353 -
 354
354 -
 355
355 -
 356
356 -
 357
357 -
 358
358 -
 359
359 -
 360
360 -
 361
361 -
 362
362 -
 363
363 -
 364
364 -
 365
365 -
 366
366 -
 367
367 -
 368
368 -
 369
369 -
 370
370 -
 371
371 -
 372
372 -
373
-
374
-
375
-
376
-
377
-
378
-
379
-
380
-
381
-
382
-
383
-
384
-
385
-
386
-
387
-
388
-
389
-
390
-
391
-
392
-
393
-
394
-
395
-
396
-
397
-
398
-
399
-
400
-
401
-
402
-
403
-
404
-
405
-
406
-
407
-
408
-
409
-
410
-
411
-
412
-
413
-
414
-
415
-
416
-
417
-
418
-
419
-
420
-
421
-
422
-
423
-
424
-
425
-
426
-
427
-
428
-
429
-
430
-
431
-
432
-
433
-
434
-
435
-
436
-
437
-
438
-
439
-
440
-
441
-
442
-
443
-
444
 |
 |
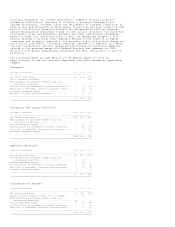
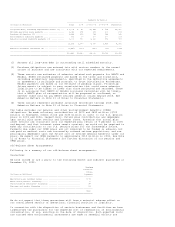
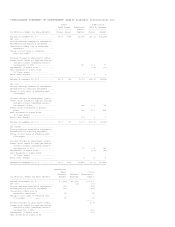
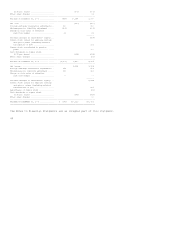
across all maturities, the potential change in fair value for foreign exchange
rate sensitive instruments based on a 10 percent increase in U.S. dollar per
local currency exchange rates across all maturities, and the potential change in
fair value of contracts hedging commodity purchases based on a 20 percent
decrease in the price of the underlying commodity across all maturities at
December 31, 2003 and 2002.
Estimated Increase
Face or (Decrease)
(Dollars in Millions) Notional Amount Carrying Value(1) Fair Value(1) In Fair Value
------------------------------------------------------------------------------------------------------------------------------
DECEMBER 31, 2003
Interest Rate Sensitive Instruments
Long-term debt (including current maturities) (2) ... $(4,945) $(4,992) $(5,508) $(148)
Interest rate swap agreements ....................... 1,189 67 67 (26)
Foreign Exchange Rate Sensitive Instruments
Foreign currency exchange contracts (3) ............. 641 1 1 (32)
Commodity Price Sensitive Instruments
Forward commodity contracts (4) ..................... -- 18 18 (13)
DECEMBER 31, 2002
Interest Rate Sensitive Instruments
Long-term debt (including current maturities) (2) ... $(4,764) $(4,812) $(5,261) $(247)
Interest rate swap agreements ....................... 1,132 76 76 (40)
Foreign Exchange Rate Sensitive Instruments
Foreign currency exchange contracts (3) ............. 1,203 (8) (8) (36)
Commodity Price Sensitive Instruments
Forward commodity contracts (4) ..................... -- 5 5 (10)
===============================================================================================================================
(1) Asset or (liability).
(2) Excludes capitalized leases.
(3) Changes in the fair value of foreign currency exchange contracts are offset
by changes in the fair value or cash flows of underlying hedged foreign
currency transactions.
(4) Changes in the fair value of forward commodity contracts are offset by
changes in the cash flows of underlying hedged commodity transactions.
The above discussion of our procedures to monitor market risk and the estimated
changes in fair value resulting from our sensitivity analyses are
forward-looking statements of market risk assuming certain adverse market
conditions occur. Actual results in the future may differ materially from these
estimated results due to actual developments in the global financial markets.
The methods used by us to assess and mitigate risk discussed above should not be
considered projections of future events.
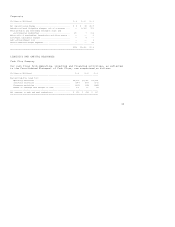
OTHER MATTERS
Litigation
See Note 21 of Notes to Financial Statements for a discussion of environmental,
asbestos and other litigation matters.
Sales to the U.S. Government
Sales to the U.S. Government, acting through its various departments and
agencies and through prime contractors, amounted to $2,595, $2,277 and $2,491
million in 2003, 2002 and 2001, respectively. This included sales to the
Department of Defense (DoD), as a prime contractor and subcontractor, of $2,269,
$1,833 and $1,631 million in 2003, 2002 and 2001, respectively. Sales to the DoD
accounted for 9.8, 8.2 and 6.9 percent of our total sales in 2003, 2002 and
2001, respectively. U.S. defense spending increased in 2003 and is also expected
to increase in 2004.
Backlog
Our total backlog at year-end 2003 and 2002 was $7,191 and $7,332 million,
respectively. We anticipate that approximately $5,573 million of the 2003
backlog will be filled in 2004. We believe that backlog is not necessarily a
reliable indicator of our future sales because a substantial portion of the
orders constituting this backlog may be canceled at the customer's option.
Inflation
Highly competitive market conditions have minimized inflation's impact on the
selling prices of our products and the costs of our purchased materials. Except
for the costs of certain raw materials in our Specialty Materials reportable
segment (See Business Overview section of this MD&A for further discussion),