Hasbro 2009 Annual Report Download - page 92
Download and view the complete annual report
Please find page 92 of the 2009 Hasbro annual report below. You can navigate through the pages in the report by either clicking on the pages listed below, or by using the keyword search tool below to find specific information within the annual report.-
 1
1 -
2
-
3
-
4
-
5
-
6
-
7
-
8
-
9
-
10
-
11
-
12
-
13
-
14
-
15
-
16
-
17
-
18
-
19
-
20
-
21
-
22
-
23
-
24
-
25
-
26
-
27
-
28
-
29
-
30
-
31
-
32
-
33
-
34
-
35
-
36
-
37
-
38
-
39
-
40
-
41
-
42
-
43
-
44
-
45
-
46
-
47
-
48
-
49
-
50
-
51
-
52
-
53
-
54
-
55
-
56
-
57
-
58
-
59
-
60
-
61
-
62
-
63
-
64
-
65
-
66
-
67
-
68
-
69
-
70
-
71
-
72
-
73
-
74
-
75
-
76
-
77
-
78
-
79
-
80
-
81
-
 82
82 -
 83
83 -
 84
84 -
 85
85 -
 86
86 -
 87
87 -
 88
88 -
 89
89 -
 90
90 -
 91
91 -
 92
92 -
 93
93 -
 94
94 -
 95
95 -
 96
96 -
 97
97 -
 98
98 -
 99
99 -
 100
100 -
 101
101 -
 102
102 -
103
-
104
-
105
-
106
-
107
-
108
 |
 |

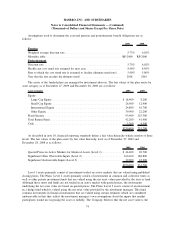
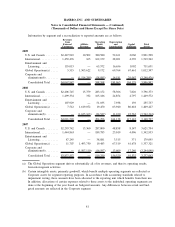
The following table presents consolidated net revenues by classes of principal products for the three fiscal
years ended December 27, 2009. Certain 2008 and 2007 amounts have been reclassified to conform to the
current period presentation.
2009 2008 2007
Boys .......................................... $1,470,975 1,344,672 1,235,462
Games and puzzles ............................... 1,340,886 1,339,909 1,329,290
Girls .......................................... 790,817 829,785 753,918
Preschool ...................................... 451,401 456,791 397,778
Other ......................................... 13,868 50,363 121,109
Net revenues .................................... $4,067,947 4,021,520 3,837,557
During 2009 and 2007, revenues from TRANSFORMERS products accounted for 14.5% and 12.6% of
consolidated net revenues, respectively. No other individual product lines accounted for 10% or more of
consolidated net revenues in 2009 or 2007. No individual product lines accounted for 10% or more of
consolidated net revenues during 2008.
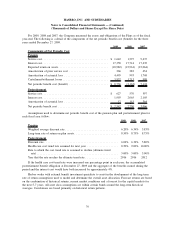
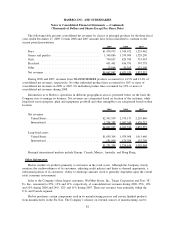
Information as to Hasbro’s operations in different geographical areas is presented below on the basis the
Company uses to manage its business. Net revenues are categorized based on location of the customer, while
long-lived assets (property, plant and equipment, goodwill and other intangibles) are categorized based on their
location:
2009 2008 2007
Net revenues
United States .................................. $2,363,559 2,339,171 2,210,840
International .................................. 1,704,388 1,682,349 1,626,717
$4,067,947 4,021,520 3,837,557
Long-lived assets
United States .................................. $1,059,304 1,079,908 1,011,660
International .................................. 191,900 174,708 133,709
$1,251,204 1,254,616 1,145,369
Principal international markets include Europe, Canada, Mexico, Australia, and Hong Kong.
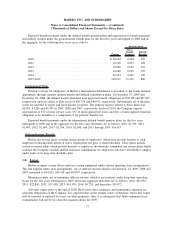
Other Information
Hasbro markets its products primarily to customers in the retail sector. Although the Company closely
monitors the creditworthiness of its customers, adjusting credit policies and limits as deemed appropriate, a
substantial portion of its customers’ ability to discharge amounts owed is generally dependent upon the overall
retail economic environment.
Sales to the Company’s three largest customers, Wal-Mart Stores, Inc., Target Corporation and Toys “R”
Us, Inc., amounted to 25%, 13% and 11%, respectively, of consolidated net revenues during 2009, 25%, 12%
and 10% during 2008 and 24%, 12% and 11% during 2007. These net revenues were primarily within the
U.S. and Canada segment.
Hasbro purchases certain components used in its manufacturing process and certain finished products
from manufacturers in the Far East. The Company’s reliance on external sources of manufacturing can be
82
HASBRO, INC. AND SUBSIDIARIES
Notes to Consolidated Financial Statements — (Continued)
(Thousands of Dollars and Shares Except Per Share Data)