Hasbro 2009 Annual Report Download - page 91
Download and view the complete annual report
Please find page 91 of the 2009 Hasbro annual report below. You can navigate through the pages in the report by either clicking on the pages listed below, or by using the keyword search tool below to find specific information within the annual report.-
 1
1 -
2
-
3
-
4
-
5
-
6
-
7
-
8
-
9
-
10
-
11
-
12
-
13
-
14
-
15
-
16
-
17
-
18
-
19
-
20
-
21
-
22
-
23
-
24
-
25
-
26
-
27
-
28
-
29
-
30
-
31
-
32
-
33
-
34
-
35
-
36
-
37
-
38
-
39
-
40
-
41
-
42
-
43
-
44
-
45
-
46
-
47
-
48
-
49
-
50
-
51
-
52
-
53
-
54
-
55
-
56
-
57
-
58
-
59
-
60
-
61
-
62
-
63
-
64
-
65
-
66
-
67
-
68
-
69
-
70
-
71
-
72
-
73
-
74
-
75
-
76
-
77
-
78
-
79
-
80
-
 81
81 -
 82
82 -
 83
83 -
 84
84 -
 85
85 -
 86
86 -
 87
87 -
 88
88 -
 89
89 -
 90
90 -
 91
91 -
 92
92 -
 93
93 -
 94
94 -
 95
95 -
 96
96 -
 97
97 -
 98
98 -
 99
99 -
 100
100 -
 101
101 -
102
-
103
-
104
-
105
-
106
-
107
-
108
 |
 |

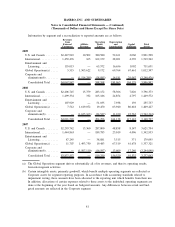
Information by segment and a reconciliation to reported amounts are as follows:
Revenues
from
External
Customers
Affiliate
Revenue
Operating
Profit
(Loss)
Depreciation
and
Amortization
Capital
Additions
Total
Assets
2009
U.S. and Canada ........ $2,447,943 10,502 380,580 52,161 2,060 3,901,598
International............ 1,459,476 165 162,159 28,201 4,339 1,519,542
Entertainment and
Licensing ............ 155,013 — 65,572 16,656 1,002 711,631
Global Operations(a) ..... 5,515 1,503,622 9,172 69,764 67,661 1,012,597
Corporate and
eliminations(b) ........ — (1,514,289) (28,885) 14,181 29,067 (3,248,476)
Consolidated Total ..... $4,067,947 — 588,598 180,963 104,129 3,896,892
2008
U.S. and Canada ........ $2,406,745 15,759 283,152 58,306 7,826 3,796,373
International............ 1,499,334 332 165,186 24,854 4,797 1,449,572
Entertainment and
Licensing ............ 107,929 — 51,035 7,938 139 255,737
Global Operations(a) ..... 7,512 1,619,072 19,450 63,940 80,618 1,409,427
Corporate and
eliminations(b) ........ — (1,635,163) (24,527) 11,100 23,763 (3,742,312)
Consolidated Total ..... $4,021,520 — 494,296 166,138 117,143 3,168,797
2007
U.S. and Canada ........ $2,293,742 13,360 287,800 48,858 8,147 3,621,754
International............ 1,444,863 — 189,783 23,019 4,096 1,342,933
Entertainment and
Licensing ............ 87,245 — 38,881 3,515 371 179,095
Global Operations(a) ..... 11,707 1,493,750 19,483 67,519 61,678 1,337,321
Corporate and
eliminations(b) ........ — (1,507,110) (16,597) 13,609 17,240 (3,244,040)
Consolidated Total ..... $3,837,557 — 519,350 156,520 91,532 3,237,063
(a) The Global Operations segment derives substantially all of its revenues, and thus its operating results,
from intersegment activities.
(b) Certain intangible assets, primarily goodwill, which benefit multiple operating segments are reflected as
Corporate assets for segment reporting purposes. In accordance with accounting standards related to
impairment testing, these amounts have been allocated to the reporting unit which benefits from their use.
In addition, allocations of certain expenses related to these assets to the individual operating segments are
done at the beginning of the year based on budgeted amounts. Any differences between actual and bud-
geted amounts are reflected in the Corporate segment.
81
HASBRO, INC. AND SUBSIDIARIES
Notes to Consolidated Financial Statements — (Continued)
(Thousands of Dollars and Shares Except Per Share Data)