Hasbro 2009 Annual Report Download - page 31
Download and view the complete annual report
Please find page 31 of the 2009 Hasbro annual report below. You can navigate through the pages in the report by either clicking on the pages listed below, or by using the keyword search tool below to find specific information within the annual report.-
 1
1 -
2
-
3
-
4
-
5
-
6
-
7
-
8
-
9
-
10
-
11
-
12
-
13
-
14
-
15
-
16
-
17
-
18
-
19
-
20
-
 21
21 -
 22
22 -
 23
23 -
 24
24 -
 25
25 -
 26
26 -
 27
27 -
 28
28 -
 29
29 -
 30
30 -
 31
31 -
 32
32 -
 33
33 -
 34
34 -
 35
35 -
 36
36 -
 37
37 -
 38
38 -
 39
39 -
 40
40 -
 41
41 -
42
-
43
-
44
-
45
-
46
-
47
-
48
-
49
-
50
-
51
-
52
-
53
-
54
-
55
-
56
-
57
-
58
-
59
-
60
-
61
-
62
-
63
-
64
-
65
-
66
-
67
-
68
-
69
-
70
-
71
-
72
-
73
-
74
-
75
-
76
-
77
-
78
-
79
-
80
-
81
-
82
-
83
-
84
-
85
-
86
-
87
-
88
-
89
-
90
-
91
-
92
-
93
-
94
-
95
-
96
-
97
-
98
-
99
-
100
-
101
-
102
-
103
-
104
-
105
-
106
-
107
-
108
 |
 |

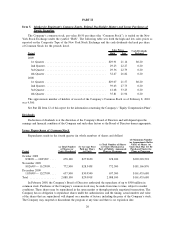
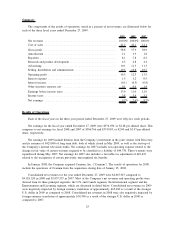
Item 6. Selected Financial Data
(Thousands of dollars and shares except per share data and ratios)
2009 2008 2007 2006 2005
Fiscal Year
Statement of Operations Data:
Net revenues ..................... $4,067,947 4,021,520 3,837,557 3,151,481 3,087,627
Net earnings ...................... $ 374,930 306,766 333,003 230,055 212,075
Per Common Share Data:
Net Earnings
Basic ......................... $ 2.69 2.18 2.13 1.38 1.19
Diluted ........................ $ 2.48 2.00 1.97 1.29 1.09
Cash dividends declared ............. $ 0.80 0.80 0.64 0.48 0.36
Balance Sheet Data:
Total assets ...................... $3,896,892 3,168,797 3,237,063 3,096,905 3,301,143
Total long-term debt ................ $1,131,998 709,723 845,071 494,917 528,389
Ratio of Earnings to Fixed Charges(1) .... 7.96 8.15 10.86 9.74 8.33
Weighted Average Number of Common
Shares:
Basic ........................... 139,487 140,877 156,054 167,100 178,303
Diluted.......................... 152,780 155,230 171,205 181,043 197,436
(1) For purposes of calculating the ratio of earnings to fixed charges, fixed charges include interest expense
and one-third of rentals; earnings available for fixed charges represent earnings before fixed charges and
income taxes.
See “Forward-Looking Information and Risk Factors That May Affect Future Results” contained in
Item 1A of this report for a discussion of risks and uncertainties that may affect future results. Also see
“Management’s Discussion and Analysis of Financial Condition and Results of Operations” contained in
Item 7 of this report for a discussion of factors affecting the comparability of information contained in
this Item 6.
21