Hasbro 2009 Annual Report Download - page 2
Download and view the complete annual report
Please find page 2 of the 2009 Hasbro annual report below. You can navigate through the pages in the report by either clicking on the pages listed below, or by using the keyword search tool below to find specific information within the annual report.-
 1
1 -
 2
2 -
 3
3 -
 4
4 -
 5
5 -
 6
6 -
 7
7 -
 8
8 -
 9
9 -
 10
10 -
 11
11 -
 12
12 -
 13
13 -
14
-
15
-
16
-
17
-
18
-
19
-
20
-
21
-
22
-
23
-
24
-
25
-
26
-
27
-
28
-
29
-
30
-
31
-
32
-
33
-
34
-
35
-
36
-
37
-
38
-
39
-
40
-
41
-
42
-
43
-
44
-
45
-
46
-
47
-
48
-
49
-
50
-
51
-
52
-
53
-
54
-
55
-
56
-
57
-
58
-
59
-
60
-
61
-
62
-
63
-
64
-
65
-
66
-
67
-
68
-
69
-
70
-
71
-
72
-
73
-
74
-
75
-
76
-
77
-
78
-
79
-
80
-
81
-
82
-
83
-
84
-
85
-
86
-
87
-
88
-
89
-
90
-
91
-
92
-
93
-
94
-
95
-
96
-
97
-
98
-
99
-
100
-
101
-
102
-
103
-
104
-
105
-
106
-
107
-
108
 |
 |

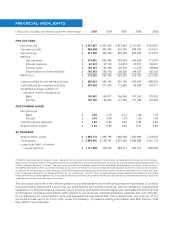
(Thousands of Dollars and Shares Except Per Share Data) 2009 2008 2007 2006 2005
FOR THE YEAR
Net revenues $ 4,067,947 4,021,520 3,837,557 3,151,481 3,087,627
Operating profit $ 588,598 494,296 519,350 376,363 310,521
Net earnings $ 374,930 306,766 333,003 230,055 212,075
EBITDA
Net earnings $ 374,930 306,766 333,003 230,055 212,075
Interest expense $ 61,603 47,143 34,618 27,521 30,537
Income taxes $ 154,767 134,289 129,379 111,419 98,838
Depreciation and amortization $ 180,963 166,138 156,520 146,707 180,132
EBITDA (1) $ 772,263 654,336 653,520 515,702 521,582
Cash provided by operating activities $ 265,623 593,185 601,794 320,647 496,624
Cash utilized by investing activities $ 497,509 271,920 112,465 83,604 120,671
Weighted average number of
common shares outstanding
Basic 139,487 140,877 156,054 167,100 178,303
Diluted 152,780 155,230 171,205 181,043 197,436
PER COMMON SHARE
Net earnings
Basic $ 2.69 2.18 2.13 1.38 1.19
Diluted $ 2.48 2.00 1.97 1.29 1.09
Cash dividends declared $ 0.80 0.80 0.64 0.48 0.36
Shareholders’ equity $ 11.63 9.99 9.54 9.57 9.69
AT YEAR-END
Shareholders’ equity $ 1,594,772 1,390,786 1,385,092 1,537,890 1,723,476
Total assets $ 3,896,892 3,168,797 3,237,063 3,096,905 3,301,143
Long-term debt, including
current portions $ 1,131,998 709,723 845,071 494,917 528,389
(1) EBITDA (earnings before interest, taxes, depreciation and amortization) represents net earnings, excluding interest expense, income taxes,
depreciation and amortization. Management believes that EBITDA is one of the appropriate measures for evaluating the operating performance
of the Company because it reflects the resources available for strategic opportunities including, among others, to invest in the business,
strengthen the balance sheet, and make strategic acquisitions. However, this measure should be considered in addition to, not as a substitute for,
or superior to, net earnings or other measures of financial performance prepared in accordance with GAAP as more fully discussed in the Com-
pany’s financial statements and filings with the SEC. As used herein, “GAAP” refers to accounting principles generally accepted in the United
States of America. See Management’s Discussion and Analysis of Financial Condition and Results of Operations in the enclosed annual report for
a detailed discussion of the Company’s business.
The discussion set forth in the following letter to our shareholders and in the annual report that follows it contains
forward-looking statements concerning our expectations and beliefs, including, without limitation, expectations
regarding our business plans and goals, future product and entertainment plans, and anticipated future financial
performance, including expectations with respect to our revenues, operating margins, earnings and uses of funds.
For a discussion of uncertainties, risks and assumptions associated with these statements, see Item 1A of our
enclosed annual report on Form 10-K, under the heading, “Forward-Looking Information and Risk Factors That
May Aect Future Results.”
FINANCIAL HIGHLIGHTS