Hasbro 2009 Annual Report Download - page 39
Download and view the complete annual report
Please find page 39 of the 2009 Hasbro annual report below. You can navigate through the pages in the report by either clicking on the pages listed below, or by using the keyword search tool below to find specific information within the annual report.-
 1
1 -
2
-
3
-
4
-
5
-
6
-
7
-
8
-
9
-
10
-
11
-
12
-
13
-
14
-
15
-
16
-
17
-
18
-
19
-
20
-
21
-
22
-
23
-
24
-
25
-
26
-
27
-
28
-
 29
29 -
 30
30 -
 31
31 -
 32
32 -
 33
33 -
 34
34 -
 35
35 -
 36
36 -
 37
37 -
 38
38 -
 39
39 -
 40
40 -
 41
41 -
 42
42 -
 43
43 -
 44
44 -
 45
45 -
 46
46 -
 47
47 -
 48
48 -
 49
49 -
50
-
51
-
52
-
53
-
54
-
55
-
56
-
57
-
58
-
59
-
60
-
61
-
62
-
63
-
64
-
65
-
66
-
67
-
68
-
69
-
70
-
71
-
72
-
73
-
74
-
75
-
76
-
77
-
78
-
79
-
80
-
81
-
82
-
83
-
84
-
85
-
86
-
87
-
88
-
89
-
90
-
91
-
92
-
93
-
94
-
95
-
96
-
97
-
98
-
99
-
100
-
101
-
102
-
103
-
104
-
105
-
106
-
107
-
108
 |
 |

positively impacted by lower obsolescence charges. In addition, gross profit in 2008 was negatively impacted
by the incremental promotional programs discussed below.
The Company’s gross profit margin decreased to 57.9% for the year ended December 28, 2008 from
58.9% in 2007. The decrease was primarily due to incremental promotional programs, including sales
allowances and markdowns, implemented in the fourth quarter of 2008 as a result of the weak retail
environment, as well as changes in product mix. Decreases in gross profit as the result of input cost inflation
were partially offset by cost savings initiatives and an increase in pricing of certain of the Company’s
products. Gross profit in 2007 was also negatively impacted by approximately $10,400 in charges related to
the recall of the Company’s EASY-BAKE oven product and by a charge of approximately $10,000 related to a
restructuring and related reduction in work force at the Company’s manufacturing facility in East Long-
meadow, Massachusetts.
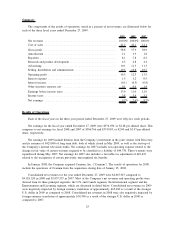
Expenses
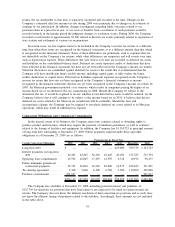
The Company’s operating expenses, stated as percentages of net revenues, are illustrated below for the
three fiscal years ended December 27, 2009:
2009 2008 2007
Amortization ................................................. 2.1% 1.9% 1.8%
Royalties .................................................... 8.1 7.8 8.2
Research and product development ................................. 4.5 4.8 4.4
Advertising .................................................. 10.1 11.3 11.3
Selling, distribution and administration .............................. 19.5 19.8 19.7
Amortization expense increased to $85,029 or 2.1% of net revenues in 2009 compared to $78,265 or
1.9% of net revenues in 2008. The increase is primarily a result of accelerated amortization related to a write-
down of the carrying value of certain property rights. Amortization expense increased to $78,265 or 1.9% of
net revenues in 2008 compared to $67,716 or 1.8% of net revenues in 2007. The increase was primarily the
result of the acquisition of Cranium in January 2008 and the purchase of the intellectual property rights related
to TRIVIAL PURSUIT in the second quarter of 2008. Property rights of $68,500 and $80,800 were recorded
as a result of the Cranium acquisition and the purchase of TRIVIAL PURSUIT, respectively, and are each
being amortized over fifteen years. The Company expects amortization expense to decrease in 2010 primarily
as a result of the property rights related to Wizards of the Coast becoming fully amortized in the fourth quarter
of 2009. Accordingly, based on the Company’s current property rights, the Company expects amortization
expense to be approximately $49,000 in 2010.
Royalty expense increased to $330,651 or 8.1% of net revenues in 2009 compared to $312,986 or 7.8%
of net revenues in 2008. The increase in royalty expense is primarily the result of increased sales of
entertainment-driven products, including TRANSFORMERS and G.I. JOE, partially offset by the impact of
foreign exchange. Royalty expense decreased to $312,986 or 7.8% of net revenues in 2008 compared to
$316,807 or 8.2% of net revenues in 2007. The decrease in royalty expense was primarily the result of the
impact of foreign exchange. Absent this foreign exchange impact, royalty expense decreased slightly as the
result of slightly lower sales of entertainment-based products.
Research and product development expense decreased in 2009 to $181,195 or 4.5% of net revenues from
$191,424 or 4.8% of net revenues in 2008. The decrease in 2009 primarily reflects an effort to reduce the
Company’s overall SKU count and make research and development spending more efficient as part of the
Company’s ongoing cost control efforts. Research and product development expense increased in 2008 to
$191,424 or 4.8% of net revenues from $167,194 or 4.4% of net revenues in 2007. The increase in 2008
reflected higher investments in the Company’s core brands, increased expenditures relating to the Company’s
digital initiatives, as well as additional expenses as a result of the Company’s Cranium acquisition. The
Company expects research and product development expense to increase in 2010, primarily as a result of costs
associated with the development of products related to the Company’s agreement with Sesame Workshop as
well as other entertainment-related properties.
29