Hasbro 2009 Annual Report Download - page 57
Download and view the complete annual report
Please find page 57 of the 2009 Hasbro annual report below. You can navigate through the pages in the report by either clicking on the pages listed below, or by using the keyword search tool below to find specific information within the annual report.-
 1
1 -
2
-
3
-
4
-
5
-
6
-
7
-
8
-
9
-
10
-
11
-
12
-
13
-
14
-
15
-
16
-
17
-
18
-
19
-
20
-
21
-
22
-
23
-
24
-
25
-
26
-
27
-
28
-
29
-
30
-
31
-
32
-
33
-
34
-
35
-
36
-
37
-
38
-
39
-
40
-
41
-
42
-
43
-
44
-
45
-
46
-
 47
47 -
 48
48 -
 49
49 -
 50
50 -
 51
51 -
 52
52 -
 53
53 -
 54
54 -
 55
55 -
 56
56 -
 57
57 -
 58
58 -
 59
59 -
 60
60 -
 61
61 -
 62
62 -
 63
63 -
 64
64 -
 65
65 -
 66
66 -
 67
67 -
68
-
69
-
70
-
71
-
72
-
73
-
74
-
75
-
76
-
77
-
78
-
79
-
80
-
81
-
82
-
83
-
84
-
85
-
86
-
87
-
88
-
89
-
90
-
91
-
92
-
93
-
94
-
95
-
96
-
97
-
98
-
99
-
100
-
101
-
102
-
103
-
104
-
105
-
106
-
107
-
108
 |
 |

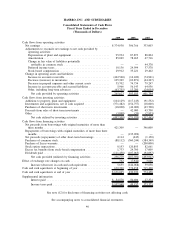
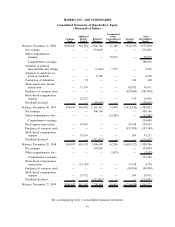
HASBRO, INC. AND SUBSIDIARIES
Consolidated Statements of Shareholders’ Equity
(Thousands of Dollars)
Common
Stock
Additional
Paid-in
Capital
Retained
Earnings
Accumulated
Other
Comprehensive
Earnings
Treasury
Stock
Total
Shareholders’
Equity
Balance, December 31, 2006 . . . $104,847 322,254 2,020,348 11,186 (920,745) 1,537,890
Net earnings .............. — — 333,003 — — 333,003
Other comprehensive
earnings ............... — — — 55,973 — 55,973
Comprehensive earnings . . . 388,976
Adoption of pension
measurement date change . . — — (2,143) 7,779 — 5,636
Adoption of uncertain tax
position standards ........ — — 8,358 — — 8,358
Conversion of debentures .... — 32 — — 136 168
Stock option and warrant
transactions ............. — 17,579 — — 82,092 99,671
Purchases of common stock . . — — — — (587,004) (587,004)
Stock-based compensation
expense ............... — 29,227 — — 175 29,402
Dividends declared ......... — — (98,005) — — (98,005)
Balance, December 30, 2007 . . . 104,847 369,092 2,261,561 74,938 (1,425,346) 1,385,092
Net earnings .............. — — 306,766 — — 306,766
Other comprehensive loss .... — — — (12,682) — (12,682)
Comprehensive earnings . . . 294,084
Stock option transactions .... — 45,947 — — 99,708 145,655
Purchases of common stock . . — — — — (357,589) (357,589)
Stock-based compensation
expense ............... — 35,116 — — 105 35,221
Dividends declared ......... — — (111,677) — — (111,677)
Balance, December 28, 2008 . . . 104,847 450,155 2,456,650 62,256 (1,683,122) 1,390,786
Net earnings .............. — — 374,930 — — 374,930
Other comprehensive loss .... — — — (3,625) — (3,625)
Comprehensive earnings . . . 371,305
Stock-based compensation
transactions ............. — (12,724) — — 17,518 4,794
Purchases of common stock . . — — — — (90,994) (90,994)
Stock-based compensation
expense ............... — 29,752 — — 160 29,912
Dividends declared ......... — — (111,031) — — (111,031)
Balance, December 27, 2009 . . . $104,847 467,183 2,720,549 58,631 (1,756,438) 1,594,772
See accompanying notes to consolidated financial statements.
47