Hasbro 2009 Annual Report Download - page 56
Download and view the complete annual report
Please find page 56 of the 2009 Hasbro annual report below. You can navigate through the pages in the report by either clicking on the pages listed below, or by using the keyword search tool below to find specific information within the annual report.-
 1
1 -
2
-
3
-
4
-
5
-
6
-
7
-
8
-
9
-
10
-
11
-
12
-
13
-
14
-
15
-
16
-
17
-
18
-
19
-
20
-
21
-
22
-
23
-
24
-
25
-
26
-
27
-
28
-
29
-
30
-
31
-
32
-
33
-
34
-
35
-
36
-
37
-
38
-
39
-
40
-
41
-
42
-
43
-
44
-
45
-
 46
46 -
 47
47 -
 48
48 -
 49
49 -
 50
50 -
 51
51 -
 52
52 -
 53
53 -
 54
54 -
 55
55 -
 56
56 -
 57
57 -
 58
58 -
 59
59 -
 60
60 -
 61
61 -
 62
62 -
 63
63 -
 64
64 -
 65
65 -
 66
66 -
67
-
68
-
69
-
70
-
71
-
72
-
73
-
74
-
75
-
76
-
77
-
78
-
79
-
80
-
81
-
82
-
83
-
84
-
85
-
86
-
87
-
88
-
89
-
90
-
91
-
92
-
93
-
94
-
95
-
96
-
97
-
98
-
99
-
100
-
101
-
102
-
103
-
104
-
105
-
106
-
107
-
108
 |
 |

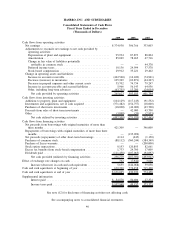
HASBRO, INC. AND SUBSIDIARIES
Consolidated Statements of Cash Flows
Fiscal Years Ended in December
(Thousands of Dollars)
2009 2008 2007
Cash flows from operating activities
Net earnings ............................................ $374,930 306,766 333,003
Adjustments to reconcile net earnings to net cash provided by
operating activities:
Depreciation of plant and equipment ........................ 95,934 87,873 88,804
Amortization .......................................... 85,029 78,265 67,716
Change in fair value of liabilities potentially
settleable in common stock ............................. — — 44,370
Deferred income taxes ................................... 19,136 24,994 37,578
Stock-based compensation ................................ 29,912 35,221 29,402
Change in operating assets and liabilities:
Increase in accounts receivable ............................ (422,560) (14,220) (74,941)
Decrease (increase) in inventories .......................... 105,329 (69,871) (44,267)
Decrease in prepaid expenses and other current assets ........... 35,702 74,734 79,247
Increase in accounts payable and accrued liabilities ............. 5,966 56,143 64,936
Other, including long-term advances ........................ (63,755) 13,280 (24,054)
Net cash provided by operating activities ................... 265,623 593,185 601,794
Cash flows from investing activities
Additions to property, plant and equipment ..................... (104,129) (117,143) (91,532)
Investments and acquisitions, net of cash acquired ................ (371,482) (154,757) (18,000)
Purchases of short-term investments........................... (18,000) (42,000) (43,700)
Proceeds from sales of short-term investments ................... — 42,000 43,700
Other ................................................. (3,898) (20) (2,933)
Net cash utilized by investing activities .................... (497,509) (271,920) (112,465)
Cash flows from financing activities
Net proceeds from borrowings with original maturities of more than
three months .......................................... 421,309 — 346,009
Repayments of borrowings with original maturities of more than three
months .............................................. — (135,092) —
Net proceeds (repayments) of other short-term borrowings .......... 4,114 (645) (1,150)
Purchases of common stock................................. (88,112) (360,244) (584,349)
Purchase of Lucas warrants ................................. — — (200,000)
Stock option transactions ................................... 9,193 120,895 82,661
Excess tax benefits from stock-based compensation ............... 1,733 24,760 17,009
Dividends paid .......................................... (111,458) (107,065) (94,097)
Net cash provided (utilized) by financing activities ............ 236,779 (457,391) (433,917)
Effect of exchange rate changes on cash ......................... 762 (7,942) 3,646
Increase (decrease) in cash and cash equivalents .............. 5,655 (144,068) 59,058
Cash and cash equivalents at beginning of year .................... 630,390 774,458 715,400
Cash and cash equivalents at end of year ......................... $636,045 630,390 774,458
Supplemental information
Interest paid . . ...................................... $ 54,578 50,696 27,374
Income taxes paid .................................... $107,948 49,152 123,325
See note (12) for disclosure of financing activities not affecting cash.
See accompanying notes to consolidated financial statements.
46