Hasbro 2009 Annual Report Download - page 30
Download and view the complete annual report
Please find page 30 of the 2009 Hasbro annual report below. You can navigate through the pages in the report by either clicking on the pages listed below, or by using the keyword search tool below to find specific information within the annual report.-
 1
1 -
2
-
3
-
4
-
5
-
6
-
7
-
8
-
9
-
10
-
11
-
12
-
13
-
14
-
15
-
16
-
17
-
18
-
19
-
 20
20 -
 21
21 -
 22
22 -
 23
23 -
 24
24 -
 25
25 -
 26
26 -
 27
27 -
 28
28 -
 29
29 -
 30
30 -
 31
31 -
 32
32 -
 33
33 -
 34
34 -
 35
35 -
 36
36 -
 37
37 -
 38
38 -
 39
39 -
 40
40 -
41
-
42
-
43
-
44
-
45
-
46
-
47
-
48
-
49
-
50
-
51
-
52
-
53
-
54
-
55
-
56
-
57
-
58
-
59
-
60
-
61
-
62
-
63
-
64
-
65
-
66
-
67
-
68
-
69
-
70
-
71
-
72
-
73
-
74
-
75
-
76
-
77
-
78
-
79
-
80
-
81
-
82
-
83
-
84
-
85
-
86
-
87
-
88
-
89
-
90
-
91
-
92
-
93
-
94
-
95
-
96
-
97
-
98
-
99
-
100
-
101
-
102
-
103
-
104
-
105
-
106
-
107
-
108
 |
 |

PART II
Item 5. Market for Registrant’s Common Equity, Related Stockholder Matters and Issuer Purchases of
Equity Securities
The Company’s common stock, par value $0.50 per share (the “Common Stock”), is traded on the New
York Stock Exchange under the symbol “HAS”. The following table sets forth the high and low sales prices as
reported on the Composite Tape of the New York Stock Exchange and the cash dividends declared per share
of Common Stock for the periods listed.
Period High Low
Cash Dividends
Declared
Sales Prices
2009
1st Quarter ....................................... $29.91 21.14 $0.20
2nd Quarter ....................................... 29.23 22.27 0.20
3rd Quarter ....................................... 29.36 22.79 0.20
4th Quarter ....................................... 32.47 26.82 0.20
2008
1st Quarter ....................................... $29.07 21.57 $0.20
2nd Quarter ....................................... 39.63 27.73 0.20
3rd Quarter ....................................... 41.68 33.23 0.20
4th Quarter ....................................... 35.81 21.94 0.20
The approximate number of holders of record of the Company’s Common Stock as of February 8, 2010
was 9,300.
See Part III, Item 12 of this report for the information concerning the Company’s “Equity Compensation Plans”.
Dividends
Declaration of dividends is at the discretion of the Company’s Board of Directors and will depend upon the
earnings and financial condition of the Company and such other factors as the Board of Directors deems appropriate.
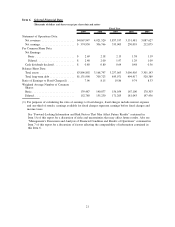
Issuer Repurchases of Common Stock
Repurchases made in the fourth quarter (in whole numbers of shares and dollars)
Period
(a) Total Number
of Shares (or
Units) Purchased
(b) Average Price
Paid per Share
(or Unit)
(c) Total Number of Shares
(or Units) Purchased as
Part of Publicly Announced
Plans or Programs
(d) Maximum Number
(or Approximate Dollar
Value) of Shares (or
Units) that May Yet Be
Purchased Under the
Plans or Programs
October 2009
9/28/09 — 10/25/09 .... 678,100 $27.9630 678,100 $203,218,501
November 2009
10/26/09 — 11/29/09.... 772,500 $28.5458 772,500 $181,166,876
December 2009
11/30/09 — 12/27/09.... 637,500 $30.9540 637,500 $161,433,680
Total ................. 2,088,100 $29.0918 2,088,100 $161,433,680
In February 2008, the Company’s Board of Directors authorized the repurchase of up to $500 million in
common stock. Purchases of the Company’s common stock may be made from time to time, subject to market
conditions. These shares may be repurchased in the open market or through privately negotiated transactions. The
Company has no obligation to repurchase shares under the authorization, and the timing, actual number and value
of the shares that are repurchased will depend on a number of factors, including the price of the Company’s stock.
The Company may suspend or discontinue the program at any time and there is no expiration date.
20