Hasbro 2009 Annual Report Download - page 36
Download and view the complete annual report
Please find page 36 of the 2009 Hasbro annual report below. You can navigate through the pages in the report by either clicking on the pages listed below, or by using the keyword search tool below to find specific information within the annual report.-
 1
1 -
2
-
3
-
4
-
5
-
6
-
7
-
8
-
9
-
10
-
11
-
12
-
13
-
14
-
15
-
16
-
17
-
18
-
19
-
20
-
21
-
22
-
23
-
24
-
25
-
 26
26 -
 27
27 -
 28
28 -
 29
29 -
 30
30 -
 31
31 -
 32
32 -
 33
33 -
 34
34 -
 35
35 -
 36
36 -
 37
37 -
 38
38 -
 39
39 -
 40
40 -
 41
41 -
 42
42 -
 43
43 -
 44
44 -
 45
45 -
 46
46 -
47
-
48
-
49
-
50
-
51
-
52
-
53
-
54
-
55
-
56
-
57
-
58
-
59
-
60
-
61
-
62
-
63
-
64
-
65
-
66
-
67
-
68
-
69
-
70
-
71
-
72
-
73
-
74
-
75
-
76
-
77
-
78
-
79
-
80
-
81
-
82
-
83
-
84
-
85
-
86
-
87
-
88
-
89
-
90
-
91
-
92
-
93
-
94
-
95
-
96
-
97
-
98
-
99
-
100
-
101
-
102
-
103
-
104
-
105
-
106
-
107
-
108
 |
 |

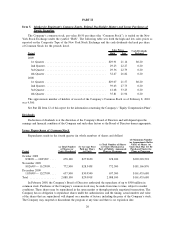
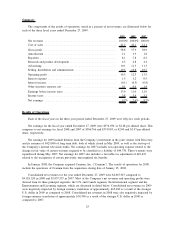
The following table presents net revenues and operating profit data for the Company’s three principal
segments for 2009, 2008 and 2007.
2009
%
Change 2008
%
Change 2007
Net Revenues
U.S. and Canada .............. $2,447,943 2% $2,406,745 5% $2,293,742
International .................. $1,459,476 (3)% $1,499,334 4% $1,444,863
Entertainment and Licensing ...... $ 155,013 44% $ 107,929 24% $ 87,245
Operating Profit
U.S. and Canada .............. $ 380,580 34% $ 283,152 (2)% $ 287,800
International .................. $ 162,159 (2)% $ 165,186 (13)% $ 189,783
Entertainment and Licensing ...... $ 65,572 28% $ 51,035 31% $ 38,881
U.S. and Canada
U.S. and Canada segment net revenues for the year ended December 27, 2009 increased 2% to
$2,447,943 from $2,406,745 in 2008. The increase in net revenues in 2009 was primarily due to increased
revenues in the boys’ toys category, primarily as a result of increased sales of TRANSFORMERS and G.I.
JOE products due to the theatrical releases of TRANSFORMERS: REVENGE OF THE FALLEN in June 2009
and G.I. JOE: THE RISE OF COBRA in August 2009, as well as increased sales of NERF products. Increased
sales in the boys’ toys category were partially offset by decreased sales of STAR WARS, MARVEL and
INDIANA JONES products. The increase in U.S. and Canada segment net revenues for 2009 was also due to
increased revenues in the preschool category primarily resulting from higher sales of TONKA and PLAY-DOH
products, partially offset by decreased sales of PLAYSKOOL products. Revenues from sales of PLAYSKOOL
products declined primarily as a result of decreased sales of ROSE PETAL COTTAGE products which are no
longer in the Company’s product line. Revenues from the girls’ toys category decreased primarily as a result
of lower sales of BABY ALIVE and I-DOG products, partially offset by sales of STRAWBERRY SHORT-
CAKE products which were reintroduced to the Company’s line in the second quarter of 2009. Although
revenues from LITTLEST PET SHOP products decreased slightly in 2009, sales of these products remained a
significant contributor to U.S. and Canada segment net revenues in 2009. Net revenues in the games and
puzzles category decreased slightly in 2009, primarily due to decreased sales of traditional board games,
partially offset by increased revenues from sales of MAGIC: THE GATHERING trading cards. Net revenues
in 2009 were also negatively impacted by decreased sales of TOOTH TUNES products, which have been
discontinued in the Company’s product line.
U.S. and Canada operating profit increased to $380,580 in 2009 from $283,152 in 2008. Operating profit
in 2009 was positively impacted by approximately $3,100 due to the translation of foreign currencies to the
U.S. dollar. U.S. and Canada gross profit increased in 2009 primarily as a result of the increased revenues
discussed above, lower obsolescence charges, and a change in the mix of products sold, primarily due to
increased sales of entertainment-based products in 2009 as compared to 2008. The increase in operating profit
for 2009 also reflects decreased selling, distribution and administration expenses which primarily reflect lower
shipping and distribution costs as well as decreased marketing and sales expenses. In addition, operating profit
increased as a result of decreased advertising expense.
U.S. and Canada segment net revenues for the year ended December 28, 2008 increased 5% to
$2,406,745 from $2,293,742 in 2007. The impact of foreign currency translation on U.S. and Canada segment
net revenues in 2008 was unfavorable and decreased net revenues by approximately $3,100. The increase in
net revenues in 2008 was primarily due to higher revenues in the boys’ toys category, driven by increased
sales of STAR WARS and NERF products and sales of INDIANA JONES products. Although revenues from
TRANSFORMERS and MARVEL products decreased in 2008 compared to 2007, as a result of the significant
sales recognized in the prior year due to the theatrical releases of TRANSFORMERS in July 2007 and
SPIDER-MAN 3 in May 2007, these lines remained significant contributors to U.S. and Canada segment net
revenues in 2008. The overall increase in segment net revenues for 2008 was also due to increased revenues in
26