Harley Davidson 2015 Annual Report Download - page 92
Download and view the complete annual report
Please find page 92 of the 2015 Harley Davidson annual report below. You can navigate through the pages in the report by either clicking on the pages listed below, or by using the keyword search tool below to find specific information within the annual report.-
 1
1 -
2
-
3
-
4
-
5
-
6
-
7
-
8
-
9
-
10
-
11
-
12
-
13
-
14
-
15
-
16
-
17
-
18
-
19
-
20
-
21
-
22
-
23
-
24
-
25
-
26
-
27
-
28
-
29
-
30
-
31
-
32
-
33
-
34
-
35
-
36
-
37
-
38
-
39
-
40
-
41
-
42
-
43
-
44
-
45
-
46
-
47
-
48
-
49
-
50
-
51
-
52
-
53
-
54
-
55
-
56
-
57
-
58
-
59
-
60
-
61
-
62
-
63
-
64
-
65
-
66
-
67
-
68
-
69
-
70
-
71
-
72
-
73
-
74
-
75
-
76
-
77
-
78
-
79
-
80
-
81
-
 82
82 -
 83
83 -
 84
84 -
 85
85 -
 86
86 -
 87
87 -
 88
88 -
 89
89 -
 90
90 -
 91
91 -
 92
92 -
 93
93 -
 94
94 -
 95
95 -
 96
96 -
 97
97 -
 98
98 -
 99
99 -
 100
100 -
 101
101 -
 102
102 -
103
-
104
-
105
-
106
-
107
-
108
-
109
-
110
-
111
-
112
-
113
-
114
-
115
-
116
-
117
-
118
-
119
 |
 |

92
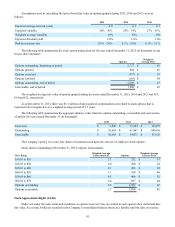
Assumptions used in calculating the lattice-based fair value of options granted during 2015, 2014 and 2013 were as
follows:
2015 2014 2013
Expected average term (in years) 6.0 6.1 6.1
Expected volatility 24% - 30% 25% - 34% 27% - 36%
Weighted average volatility 28% 32% 33%
Expected dividend yield 2.0% 1.8% 1.6%
Risk-free interest rate 0.1% - 2.0% 0.1% - 2.8% 0.1% - 2.1%
The following table summarizes the stock option transactions for the year ended December 31, 2015 (in thousands except
for per share amounts):
Options Weighted-
Average Price
Options outstanding, beginning of period 2,717 $ 43
Options granted 468 $ 63
Options exercised (517) $ 39
Options forfeited (165) $ 64
Options outstanding, end of period 2,503 $ 47
Exercisable, end of period 1,888 $ 42
The weighted-average fair value of options granted during the years ended December 31, 2015, 2014 and 2013 was $13,
$14 and $12, respectively.
As of December 31, 2015, there was $3.3 million of unrecognized compensation cost related to stock options that is
expected to be recognized over a weighted-average period of 1.7 years.
The following table summarizes the aggregate intrinsic value related to options outstanding, exercisable and exercised as
of and for the years ended December 31 (in thousands):
2015 2014 2013
Exercised $ 9,890 $ 31,623 $ 28,879
Outstanding $ 16,605 $ 61,947 $ 100,054
Exercisable $ 16,605 $ 54,071 $ 81,930
The Company’s policy is to issue new shares of common stock upon the exercise of employee stock options.
Stock options outstanding at December 31, 2015 (options in thousands):
Price Range Weighted-Average
Contractual Life Options Weighted-Average
Exercise Price
$10.01 to $20 3.1 322 $ 13
$20.01 to $30 4.0 200 $ 24
$30.01 to $40 2.1 202 $ 39
$40.01 to $50 5.1 418 $ 44
$50.01 to $60 4.5 464 $ 52
$60.01 to $70 6.4 897 $ 64
Options outstanding 4.9 2,503 $ 47
Options exercisable 3.7 1,888 $ 42
Stock Appreciation Rights (SARs)
SARs vest under the same terms and conditions as options; however, they are settled in cash equal to their settlement date
fair value. As a result, SARs are recorded in the Company’s consolidated balance sheets as a liability until the date of exercise.