Harley Davidson 2015 Annual Report Download - page 23
Download and view the complete annual report
Please find page 23 of the 2015 Harley Davidson annual report below. You can navigate through the pages in the report by either clicking on the pages listed below, or by using the keyword search tool below to find specific information within the annual report.-
 1
1 -
2
-
3
-
4
-
5
-
6
-
7
-
8
-
9
-
10
-
11
-
12
-
 13
13 -
 14
14 -
 15
15 -
 16
16 -
 17
17 -
 18
18 -
 19
19 -
 20
20 -
 21
21 -
 22
22 -
 23
23 -
 24
24 -
 25
25 -
 26
26 -
 27
27 -
 28
28 -
 29
29 -
 30
30 -
 31
31 -
 32
32 -
 33
33 -
34
-
35
-
36
-
37
-
38
-
39
-
40
-
41
-
42
-
43
-
44
-
45
-
46
-
47
-
48
-
49
-
50
-
51
-
52
-
53
-
54
-
55
-
56
-
57
-
58
-
59
-
60
-
61
-
62
-
63
-
64
-
65
-
66
-
67
-
68
-
69
-
70
-
71
-
72
-
73
-
74
-
75
-
76
-
77
-
78
-
79
-
80
-
81
-
82
-
83
-
84
-
85
-
86
-
87
-
88
-
89
-
90
-
91
-
92
-
93
-
94
-
95
-
96
-
97
-
98
-
99
-
100
-
101
-
102
-
103
-
104
-
105
-
106
-
107
-
108
-
109
-
110
-
111
-
112
-
113
-
114
-
115
-
116
-
117
-
118
-
119
 |
 |
23
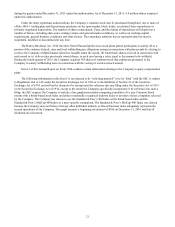
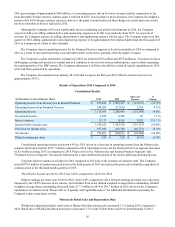
Item 6. Selected Financial Data
(In thousands, except per share amounts) 2015 2014 2013 2012 2011
Statement of income data:
Revenue:
Motorcycles & Related Products $ 5,308,744 $ 5,567,681 $ 5,258,290 $ 4,942,582 $ 4,662,264
Financial Services 686,658 660,827 641,582 637,924 649,449
Total revenue $ 5,995,402 $ 6,228,508 $ 5,899,872 $ 5,580,506 $ 5,311,713
Income from continuing
operations $ 752,207 $ 844,611 $ 733,993 $ 623,925 $ 548,078
Income from discontinued
operations, net of tax — — — — 51,036
Net income $ 752,207 $ 844,611 $ 733,993 $ 623,925 $ 599,114
Weighted-average common shares:
Basic 202,681 216,305 222,475 227,119 232,889
Diluted 203,686 217,706 224,071 229,229 234,918
Earnings per common share from
continuing operations:
Basic $ 3.71 $ 3.90 $ 3.30 $ 2.75 $ 2.35
Diluted $ 3.69 $ 3.88 $ 3.28 $ 2.72 $ 2.33
Earnings per common share from
discontinued operations:
Basic $ — $ — $ — $ — $ 0.22
Diluted $ — $ — $ — $ — $ 0.22
Earnings per common share:
Basic $ 3.71 $ 3.90 $ 3.30 $ 2.75 $ 2.57
Diluted $ 3.69 $ 3.88 $ 3.28 $ 2.72 $ 2.55
Dividends paid per common share $ 1.240 $ 1.100 $ 0.840 $ 0.620 $ 0.475
Balance sheet data:
Total assets $ 9,991,167 $ 9,528,097 $ 9,405,040 $ 9,170,773 $ 9,674,164
Total debt $ 6,890,388 $ 5,504,629 $ 5,259,170 $ 5,102,649 $ 5,722,619
Total equity $ 1,839,654 $ 2,909,286 $ 3,009,486 $ 2,557,624 $ 2,420,256