Harley Davidson 2015 Annual Report Download - page 57
Download and view the complete annual report
Please find page 57 of the 2015 Harley Davidson annual report below. You can navigate through the pages in the report by either clicking on the pages listed below, or by using the keyword search tool below to find specific information within the annual report.-
 1
1 -
2
-
3
-
4
-
5
-
6
-
7
-
8
-
9
-
10
-
11
-
12
-
13
-
14
-
15
-
16
-
17
-
18
-
19
-
20
-
21
-
22
-
23
-
24
-
25
-
26
-
27
-
28
-
29
-
30
-
31
-
32
-
33
-
34
-
35
-
36
-
37
-
38
-
39
-
40
-
41
-
42
-
43
-
44
-
45
-
46
-
 47
47 -
 48
48 -
 49
49 -
 50
50 -
 51
51 -
 52
52 -
 53
53 -
 54
54 -
 55
55 -
 56
56 -
 57
57 -
 58
58 -
 59
59 -
 60
60 -
 61
61 -
 62
62 -
 63
63 -
 64
64 -
 65
65 -
 66
66 -
 67
67 -
68
-
69
-
70
-
71
-
72
-
73
-
74
-
75
-
76
-
77
-
78
-
79
-
80
-
81
-
82
-
83
-
84
-
85
-
86
-
87
-
88
-
89
-
90
-
91
-
92
-
93
-
94
-
95
-
96
-
97
-
98
-
99
-
100
-
101
-
102
-
103
-
104
-
105
-
106
-
107
-
108
-
109
-
110
-
111
-
112
-
113
-
114
-
115
-
116
-
117
-
118
-
119
 |
 |

57
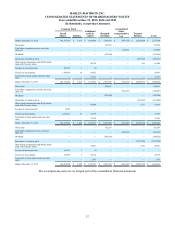
HARLEY-DAVIDSON, INC.
CONSOLIDATED STATEMENTS OF SHAREHOLDERS’ EQUITY
Years ended December 31, 2015, 2014 and 2013
(In thousands, except share amounts)
Common Stock Additional
paid-in
capital Retained
Earnings
Accumulated
Other
comprehensive
loss Treasury
Balance Total
Issued
Shares Balance
Balance December 31, 2012 341,265,838 $ 3,413 $ 1,066,069 $ 7,306,424 $ (607,678) $ (5,210,604) $ 2,557,624
Net income — — — 733,993 — — 733,993
Total other comprehensive loss, net of tax
(Note 10) — — — — 275,002 — 275,002
Dividends — — — (187,688) — — (187,688)
Repurchase of common stock — — — — — (479,231)(479,231)
Share-based compensation and 401(k) match
made with Treasury shares — — 40,724 — — 784 41,508
Issuance of nonvested stock 492,755 5 (5) — — — —
Exercise of stock options 1,398,638 14 50,553 — — — 50,567
Tax benefit of stock options and nonvested
stock — — 17,711 — — — 17,711
Balance December 31, 2013 343,157,231 $ 3,432 $ 1,175,052 $ 7,852,729 $ (332,676) $ (5,689,051) $ 3,009,486
Net income — — — 844,611 — — 844,611
Total other comprehensive income, net of tax
(Note 10) — — — — (182,267) — (182,267)
Dividends — — — (238,300) — — (238,300)
Repurchase of common stock — — — — — (615,602)(615,602)
Share-based compensation and 401(k) match
made with Treasury shares — — 40,848 — — 1,143 41,991
Issuance of nonvested stock 15,891 — — — — — —
Exercise of stock options 1,001,531 10 37,775 — — — 37,785
Tax benefit of stock options and nonvested
stock — — 11,582 — — — 11,582
Balance December 31, 2014 344,174,653 $ 3,442 $ 1,265,257 $ 8,459,040 $ (514,943) $ (6,303,510) $ 2,909,286
Net income — — — 752,207 — — 752,207
Total other comprehensive loss, net of tax
(Note 10) — — — — (100,262) — (100,262)
Dividends — — — (249,262) — — (249,262)
Repurchase of common stock — — — — — (1,537,020)(1,537,020)
Share-based compensation and 401(k) match
made with Treasury shares — — 39,457 — — 1,394 40,851
Issuance of nonvested stock 162,193 2 (2) — — — —
Exercise of stock options 518,858 5 20,174 — — — 20,179
Tax benefit of stock options and nonvested
stock — — 3,675 — — — 3,675
Balance December 31, 2015 344,855,704 $ 3,449 $ 1,328,561 $ 8,961,985 $ (615,205) $ (7,839,136) $ 1,839,654
The accompanying notes are an integral part of the consolidated financial statements.