Harley Davidson 2015 Annual Report Download - page 26
Download and view the complete annual report
Please find page 26 of the 2015 Harley Davidson annual report below. You can navigate through the pages in the report by either clicking on the pages listed below, or by using the keyword search tool below to find specific information within the annual report.-
 1
1 -
2
-
3
-
4
-
5
-
6
-
7
-
8
-
9
-
10
-
11
-
12
-
13
-
14
-
15
-
 16
16 -
 17
17 -
 18
18 -
 19
19 -
 20
20 -
 21
21 -
 22
22 -
 23
23 -
 24
24 -
 25
25 -
 26
26 -
 27
27 -
 28
28 -
 29
29 -
 30
30 -
 31
31 -
 32
32 -
 33
33 -
 34
34 -
 35
35 -
 36
36 -
37
-
38
-
39
-
40
-
41
-
42
-
43
-
44
-
45
-
46
-
47
-
48
-
49
-
50
-
51
-
52
-
53
-
54
-
55
-
56
-
57
-
58
-
59
-
60
-
61
-
62
-
63
-
64
-
65
-
66
-
67
-
68
-
69
-
70
-
71
-
72
-
73
-
74
-
75
-
76
-
77
-
78
-
79
-
80
-
81
-
82
-
83
-
84
-
85
-
86
-
87
-
88
-
89
-
90
-
91
-
92
-
93
-
94
-
95
-
96
-
97
-
98
-
99
-
100
-
101
-
102
-
103
-
104
-
105
-
106
-
107
-
108
-
109
-
110
-
111
-
112
-
113
-
114
-
115
-
116
-
117
-
118
-
119
 |
 |

26
2016 gross margin of approximately $60 million, or 1 percentage point, driven by lower revenues and the comparison to the
more favorable foreign currency contract gains it realized in 2015. In accordance with its practices, the Company has hedged a
portion of its 2016 foreign currency exposure; however, the gains it would realize on those hedges at current spot rates would
not be as favorable as those it realized in 2015.
Although the Company will invest significantly more in marketing and product development in 2016, the Company
expects its full-year selling, administrative and engineering expenses to be flat to up modestly from 2015. As a percent of
revenue, the Company expects its selling, administrative and engineering expense will decrease. The Company expects its first
quarter of 2016 selling, administrative and engineering expense to be approximately $25 million higher than the first quarter of
2015 as it ramps up its efforts to drive demand.
The Company expects operating income for the Financial Services segment to be down modestly in 2016 as compared to
2015 as a result of increased borrowing costs and unfavorable credit losses, partially offset by higher revenues.
The Company's capital expenditure estimates for 2016 are between $255 million and $275 million as it increases its focus
on bringing exciting new products to market and as it continues to invest in its systems infrastructure, most notably expanding
the implementation of its ERP system. The Company anticipates it will have the ability to fund all capital expenditures in 2016
with cash flows generated by operations.
The Company also announced on January 28, 2016 that it expects the full year 2016 effective income tax rate to be
approximately 34.5%.
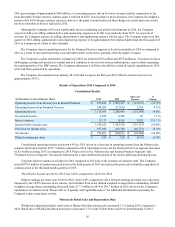
Results of Operations 2015 Compared to 2014
Consolidated Results
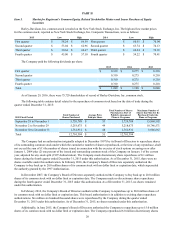
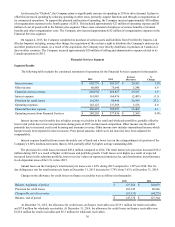
(in thousands, except earnings per share) 2015 2014 (Decrease)
Increase %
Change
Operating income from Motorcycles & Related Products $ 875,490 $ 1,003,147 $ (127,657) (12.7)%
Operating income from Financial Services 280,205 277,836 2,369 0.9 %
Operating income 1,155,695 1,280,983 (125,288) (9.8)%
Investment income 6,585 6,499 86 1.3 %
Interest expense 12,117 4,162 7,955 191.1 %
Income before income taxes 1,150,163 1,283,320 (133,157) (10.4)%
Provision for income taxes 397,956 438,709 (40,753) (9.3)%
Net income $ 752,207 $ 844,611 $ (92,404) (10.9)%
Diluted earnings per share $ 3.69 $ 3.88 $ (0.19) (4.9)%
Consolidated operating income was down 9.8% in 2015 driven by a decrease in operating income from the Motorcycles
segment which decreased by $127.7 million compared to 2014. Operating income for the Financial Services segment increased
by $2.4 million during 2015 as compared to 2014. Please refer to the “Motorcycles and Related Products Segment” and
“Financial Services Segment” discussions following for a more detailed discussion of the factors affecting operating income.
Corporate interest expense was higher in 2015 compared to 2014 due to the issuance of corporate debt. The Company
issued $750.0 million of senior unsecured notes in the third quarter of 2015 and utilized the proceeds to fund the repurchase of
common stock in the third and fourth quarters of 2015.
The effective income tax rate for 2015 was 34.6% compared to 34.2% for 2014.
Diluted earnings per share were $3.69 in 2015, down 4.9% compared to 2014. Diluted earnings per share were adversely
impacted by the 10.9% decrease in net income, but benefited from lower diluted weighted average shares outstanding. Diluted
weighted average shares outstanding decreased from 217.7 million in 2014 to 203.7 million in 2015 driven by the Company's
repurchases of common stock. Please refer to "Liquidity and Capital Resources" for additional information concerning the
Company's share repurchase activity.
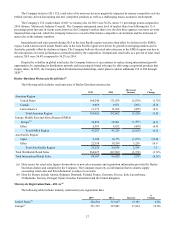
Motorcycle Retail Sales and Registration Data
Worldwide independent dealer retail sales of Harley-Davidson motorcycles decreased 1.3% during 2015 compared to
2014. Retail sales of Harley-Davidson motorcycles decreased 1.7% in the United States and 0.5% internationally in 2015.