Harley Davidson 2015 Annual Report Download - page 101
Download and view the complete annual report
Please find page 101 of the 2015 Harley Davidson annual report below. You can navigate through the pages in the report by either clicking on the pages listed below, or by using the keyword search tool below to find specific information within the annual report.-
 1
1 -
2
-
3
-
4
-
5
-
6
-
7
-
8
-
9
-
10
-
11
-
12
-
13
-
14
-
15
-
16
-
17
-
18
-
19
-
20
-
21
-
22
-
23
-
24
-
25
-
26
-
27
-
28
-
29
-
30
-
31
-
32
-
33
-
34
-
35
-
36
-
37
-
38
-
39
-
40
-
41
-
42
-
43
-
44
-
45
-
46
-
47
-
48
-
49
-
50
-
51
-
52
-
53
-
54
-
55
-
56
-
57
-
58
-
59
-
60
-
61
-
62
-
63
-
64
-
65
-
66
-
67
-
68
-
69
-
70
-
71
-
72
-
73
-
74
-
75
-
76
-
77
-
78
-
79
-
80
-
81
-
82
-
83
-
84
-
85
-
86
-
87
-
88
-
89
-
90
-
 91
91 -
 92
92 -
 93
93 -
 94
94 -
 95
95 -
 96
96 -
 97
97 -
 98
98 -
 99
99 -
 100
100 -
 101
101 -
 102
102 -
 103
103 -
 104
104 -
 105
105 -
 106
106 -
 107
107 -
 108
108 -
 109
109 -
 110
110 -
 111
111 -
112
-
113
-
114
-
115
-
116
-
117
-
118
-
119
 |
 |
101
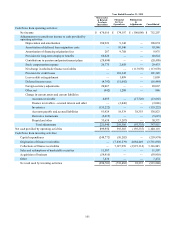
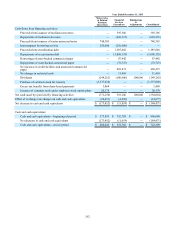
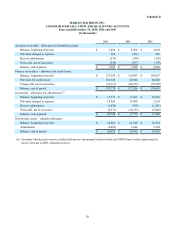
Year Ended December 31, 2015
Motorcycles
& Related
Products
Operations
Financial
Services
Operations
Eliminations
&
Adjustments Consolidated
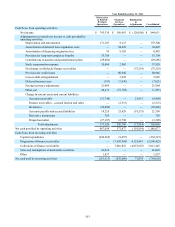
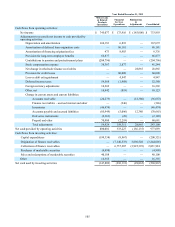
Cash flows from operating activities:
Net income $ 678,010 $ 174,197 $ (100,000) $ 752,207
Adjustments to reconcile net income to cash provided by
operating activities:
Depreciation and amortization 188,926 9,148 — 198,074
Amortization of deferred loan origination costs — 93,546 — 93,546
Amortization of financing origination fees 267 9,708 — 9,975
Provision for long-term employee benefits 60,824 — — 60,824
Contributions to pension and postretirement plans (28,490) — — (28,490)
Stock compensation expense 26,775 2,658 — 29,433
Net change in wholesale finance receivables — — (113,970)(113,970)
Provision for credit losses — 101,345 — 101,345
Loss on debt extinguishment — 1,099 — 1,099
Deferred income taxes (4,792)(11,692) — (16,484)
Foreign currency adjustments 20,067 — — 20,067
Other, net (442) 1,288 — 846
Change in current assets and current liabilities:
Accounts receivable 4,055 — (17,720)(13,665)
Finance receivables—accrued interest and other — (3,046) — (3,046)
Inventories (155,222) — — (155,222)
Accounts payable and accrued liabilities 81,929 18,539 38,355 138,823
Derivative instruments (5,615) — — (5,615)
Prepaid and other 33,658 (3,287) — 30,371
Total adjustments 221,940 219,306 (93,335) 347,911
Net cash provided by operating activities 899,950 393,503 (193,335) 1,100,118
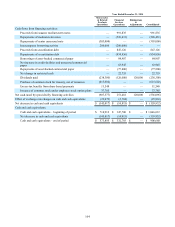
Cash flows from investing activities:
Capital expenditures (249,772)(10,202) — (259,974)
Origination of finance receivables — (7,836,279) 4,084,449 (3,751,830)
Collections of finance receivables — 7,127,999 (3,991,114) 3,136,885
Sales and redemptions of marketable securities 11,507 — — 11,507
Acquisition of business (59,910) — — (59,910)
Other 7,474 — — 7,474
Net cash used by investing activities (290,701)(718,482) 93,335 (915,848)