Harley Davidson 2015 Annual Report Download - page 88
Download and view the complete annual report
Please find page 88 of the 2015 Harley Davidson annual report below. You can navigate through the pages in the report by either clicking on the pages listed below, or by using the keyword search tool below to find specific information within the annual report.-
 1
1 -
2
-
3
-
4
-
5
-
6
-
7
-
8
-
9
-
10
-
11
-
12
-
13
-
14
-
15
-
16
-
17
-
18
-
19
-
20
-
21
-
22
-
23
-
24
-
25
-
26
-
27
-
28
-
29
-
30
-
31
-
32
-
33
-
34
-
35
-
36
-
37
-
38
-
39
-
40
-
41
-
42
-
43
-
44
-
45
-
46
-
47
-
48
-
49
-
50
-
51
-
52
-
53
-
54
-
55
-
56
-
57
-
58
-
59
-
60
-
61
-
62
-
63
-
64
-
65
-
66
-
67
-
68
-
69
-
70
-
71
-
72
-
73
-
74
-
75
-
76
-
77
-
 78
78 -
 79
79 -
 80
80 -
 81
81 -
 82
82 -
 83
83 -
 84
84 -
 85
85 -
 86
86 -
 87
87 -
 88
88 -
 89
89 -
 90
90 -
 91
91 -
 92
92 -
 93
93 -
 94
94 -
 95
95 -
 96
96 -
 97
97 -
 98
98 -
99
-
100
-
101
-
102
-
103
-
104
-
105
-
106
-
107
-
108
-
109
-
110
-
111
-
112
-
113
-
114
-
115
-
116
-
117
-
118
-
119
 |
 |

88
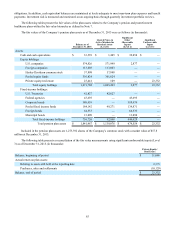
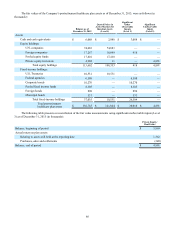
The fair values of the Company’s postretirement healthcare plan assets as of December 31, 2014, were as follows (in
thousands):
Balance as of
December 31, 2014
Quoted Prices in
Active Markets for
Identical Assets
(Level 1)
Significant
Other
Observable
Inputs
(Level 2)
Significant
Unobservable
Inputs
(Level 3)
Assets:
Cash and cash equivalents $ 8,033 $ 7,278 $ 755 $ —
Equity holdings:
U.S. companies 75,349 75,349 — —
Foreign companies 15,571 15,050 521 —
Pooled equity funds 19,138 19,138 — —
Private equity/real estate 3,884 15 — 3,869
Total equity holdings 113,942 109,552 521 3,869
Fixed-income holdings:
U.S. Treasuries 11,457 11,457 — —
Federal agencies 1,876 — 1,876 —
Corporate bonds 11,549 — 11,549 —
Pooled fixed income funds 8,996 — 8,996 —
Foreign bonds 770 — 770 —
Municipal bonds 217 — 217 —
Total fixed-income holdings 34,865 11,457 23,408 —
Total postretirement
healthcare plan assets $ 156,840 $ 128,287 $ 24,684 $ 3,869
The following table presents a reconciliation of the fair value measurements using significant unobservable inputs (Level
3) as of December 31, 2014 (in thousands):
Private Equity/
Real Estate
Balance, beginning of period $ —
Actual return on plan assets:
Relating to assets still held at the reporting date (178)
Purchases, sales and settlements 4,047
Balance, end of period $ 3,869
No plan assets are expected to be returned to the Company during the fiscal year ending December 31, 2016.
For 2016, the Company’s overall expected long-term rate of return is 7.5% for pension assets and 7.5% for postretirement
healthcare plan assets. The expected long-term rate of return is based on the portfolio as a whole and not on the sum of the
returns on individual asset categories. The return is based on historical returns adjusted to reflect the current view of the long-
term investment market.
Postretirement Healthcare Cost:
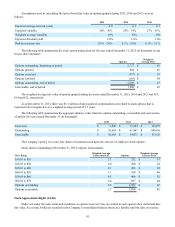
The weighted-average healthcare cost trend rate used in determining the accumulated postretirement benefit obligation of
the healthcare plans was as follows:
2015 2014
Healthcare cost trend rate for next year 7.5% 8.0%
Rate to which the cost trend rate is assumed to decline (the ultimate rate) 5.0% 5.0%
Year that the rate reaches the ultimate trend rate 2021 2021