Harley Davidson 2015 Annual Report Download - page 35
Download and view the complete annual report
Please find page 35 of the 2015 Harley Davidson annual report below. You can navigate through the pages in the report by either clicking on the pages listed below, or by using the keyword search tool below to find specific information within the annual report.-
 1
1 -
2
-
3
-
4
-
5
-
6
-
7
-
8
-
9
-
10
-
11
-
12
-
13
-
14
-
15
-
16
-
17
-
18
-
19
-
20
-
21
-
22
-
23
-
24
-
 25
25 -
 26
26 -
 27
27 -
 28
28 -
 29
29 -
 30
30 -
 31
31 -
 32
32 -
 33
33 -
 34
34 -
 35
35 -
 36
36 -
 37
37 -
 38
38 -
 39
39 -
 40
40 -
 41
41 -
 42
42 -
 43
43 -
 44
44 -
 45
45 -
46
-
47
-
48
-
49
-
50
-
51
-
52
-
53
-
54
-
55
-
56
-
57
-
58
-
59
-
60
-
61
-
62
-
63
-
64
-
65
-
66
-
67
-
68
-
69
-
70
-
71
-
72
-
73
-
74
-
75
-
76
-
77
-
78
-
79
-
80
-
81
-
82
-
83
-
84
-
85
-
86
-
87
-
88
-
89
-
90
-
91
-
92
-
93
-
94
-
95
-
96
-
97
-
98
-
99
-
100
-
101
-
102
-
103
-
104
-
105
-
106
-
107
-
108
-
109
-
110
-
111
-
112
-
113
-
114
-
115
-
116
-
117
-
118
-
119
 |
 |

35
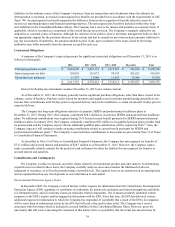
• Manufacturing costs for 2014 benefited from increased year-over-year production, restructuring savings, lower
temporary inefficiencies and lower pension costs compared to 2013. The manufacturing cost benefits were partially
offset by start-up costs of approximately $15.3 million associated with the launch of the Street platform of
motorcycles.
The net increase in operating expense was primarily due to higher selling and administrative expenses and the absence of
the restructuring benefit recorded in 2013, partially offset by lower engineering expense. The higher selling and administrative
expenses were primarily due to higher spending in support of the Company's growth initiatives and higher recall costs. In 2013,
the Company completed work related to its various restructuring activities that were initiated during 2009 through 2011.
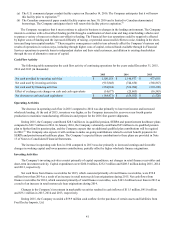
Financial Services Segment
Segment Results
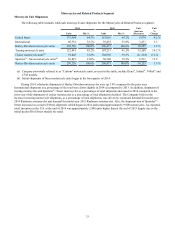
The following table includes the condensed statements of operations for the Financial Services segment (in thousands):
2014 2013 Increase
(Decrease) %
Change
Interest income $ 585,187 $ 575,652 $ 9,535 1.7 %
Other income 75,640 65,930 9,710 14.7
Financial services revenue 660,827 641,582 19,245 3.0
Interest expense 164,476 165,491 (1,015) (0.6)
Provision for credit losses 80,946 60,008 20,938 34.9
Operating expenses 137,569 132,990 4,579 3.4
Financial Services expense 382,991 358,489 24,502 6.8
Operating income from Financial Services $ 277,836 $ 283,093 $ (5,257) (1.9)%
Interest income was favorable due to higher retail and wholesale outstanding finance receivables, partially offset by lower
yields primarily on retail finance receivables due to increased competition. Other income was favorable primarily due to
increased credit card licensing and insurance revenue. Other income now includes international income which had previously
been reported in interest income. Amounts for 2014 and 2013, which were not material, have been adjusted for comparability.
Interest expense benefited from a more favorable cost of funds and a lower loss on the extinguishment of a portion of the
Company's 6.80% medium-term notes than in 2013, partially offset by higher average outstanding debt.
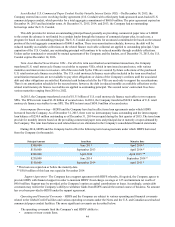
The provision for credit losses increased $20.9 million compared to 2013. The retail motorcycle provision increased $20.0
million during 2014 as a result of higher credit losses, an increase in the retail motorcycle reserve rate, and portfolio growth.
Credit losses were impacted by lower recovery values of repossessed motorcycles, the impact of changing consumer behavior,
and lower recoveries as a result of fewer charge-offs in prior periods.
Annual losses on the Company's retail motorcycle loans were 1.22% during 2014 compared to 1.09% in 2013. The 30-
day delinquency rate for retail motorcycle loans at December 31, 2014 decreased to 3.61% from 3.71% at December 31, 2013.
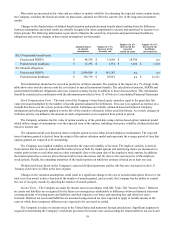
Changes in the allowance for credit losses on finance receivables were as follows (in thousands):
2014 2013
Balance, beginning of period $ 110,693 $ 107,667
Provision for credit losses 80,946 60,008
Charge-offs, net of recoveries (64,275)(56,982)
Balance, end of period $ 127,364 $ 110,693
At December 31, 2014, the allowance for credit losses on finance receivables was $122.0 million for retail receivables
and $5.3 million for wholesale receivables. At December 31, 2013, the allowance for credit losses on finance receivables was
$106.1 million for retail receivables and $4.6 million for wholesale receivables.