Harley Davidson 2015 Annual Report Download - page 73
Download and view the complete annual report
Please find page 73 of the 2015 Harley Davidson annual report below. You can navigate through the pages in the report by either clicking on the pages listed below, or by using the keyword search tool below to find specific information within the annual report.-
 1
1 -
2
-
3
-
4
-
5
-
6
-
7
-
8
-
9
-
10
-
11
-
12
-
13
-
14
-
15
-
16
-
17
-
18
-
19
-
20
-
21
-
22
-
23
-
24
-
25
-
26
-
27
-
28
-
29
-
30
-
31
-
32
-
33
-
34
-
35
-
36
-
37
-
38
-
39
-
40
-
41
-
42
-
43
-
44
-
45
-
46
-
47
-
48
-
49
-
50
-
51
-
52
-
53
-
54
-
55
-
56
-
57
-
58
-
59
-
60
-
61
-
62
-
 63
63 -
 64
64 -
 65
65 -
 66
66 -
 67
67 -
 68
68 -
 69
69 -
 70
70 -
 71
71 -
 72
72 -
 73
73 -
 74
74 -
 75
75 -
 76
76 -
 77
77 -
 78
78 -
 79
79 -
 80
80 -
 81
81 -
 82
82 -
 83
83 -
84
-
85
-
86
-
87
-
88
-
89
-
90
-
91
-
92
-
93
-
94
-
95
-
96
-
97
-
98
-
99
-
100
-
101
-
102
-
103
-
104
-
105
-
106
-
107
-
108
-
109
-
110
-
111
-
112
-
113
-
114
-
115
-
116
-
117
-
118
-
119
 |
 |

73
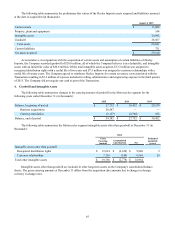
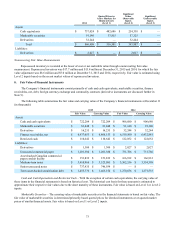
2014
Quoted Prices in
Active Markets for
Identical Assets
(Level 1)
Significant
Other
Observable
Inputs
(Level 2)
Significant
Unobservable
Inputs
(Level 3)
Assets:
Cash equivalents $ 737,024 $ 482,686 $ 254,338 $ —
Marketable securities 91,140 33,815 57,325 —
Derivatives 32,244 — 32,244 —
Total $ 860,408 $ 516,501 $ 343,907 $ —
Liabilities:
Derivatives $ 2,027 $ — $ 2,027 $ —
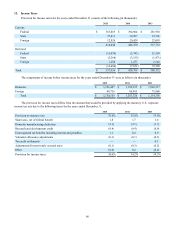
Nonrecurring Fair Value Measurements
Repossessed inventory is recorded at the lower of cost or net realizable value through a nonrecurring fair value
measurement. Repossessed inventory was $17.7 million and $13.4 million at December 31, 2015 and 2014, for which the fair
value adjustment was $8.6 million and $5.0 million at December 31, 2015 and 2014, respectively. Fair value is estimated using
Level 2 inputs based on the recent market values of repossessed inventory.
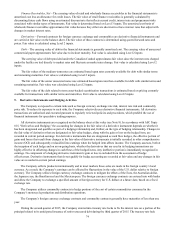
8. Fair Value of Financial Instruments
The Company’s financial instruments consist primarily of cash and cash equivalents, marketable securities, finance
receivables, net, debt, foreign currency exchange and commodity contracts (derivative instruments are discussed further in
Note 9).
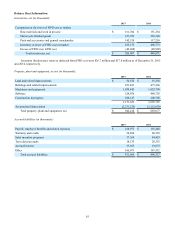
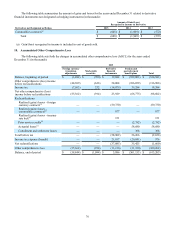
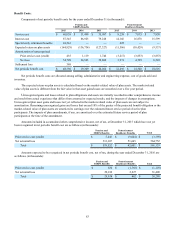
The following table summarizes the fair value and carrying value of the Company’s financial instruments at December 31
(in thousands):
2015 2014
Fair Value Carrying Value Fair Value Carrying Value
Assets:
Cash and cash equivalents $ 722,209 $ 722,209 $ 906,680 $ 906,680
Marketable securities $ 81,448 $ 81,448 $ 91,140 $ 91,140
Derivatives $ 16,235 $ 16,235 $ 32,244 $ 32,244
Finance receivables, net $ 6,937,053 $ 6,868,153 $ 6,519,500 $ 6,432,881
Restricted cash $ 110,642 $ 110,642 $ 122,052 $ 122,052
Liabilities:
Derivatives $ 1,300 $ 1,300 $ 2,027 $ 2,027
Unsecured commercial paper $ 1,201,380 $ 1,201,380 $ 731,786 $ 731,786
Asset-backed Canadian commercial
paper conduit facility $ 153,839 $ 153,839 $ 166,912 $ 166,912
Medium-term notes $ 3,410,966 $ 3,325,081 $ 3,502,536 $ 3,334,398
Senior unsecured notes $ 737,435 $ 746,934 $ — $ —
Term asset-backed securitization debt $ 1,455,776 $ 1,463,154 $ 1,270,656 $ 1,271,533
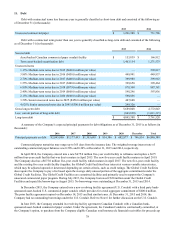
Cash and Cash Equivalents and Restricted Cash – With the exception of certain cash equivalents, the carrying value of
these items in the financial statements is based on historical cost. The historical cost basis for these amounts is estimated to
approximate their respective fair values due to the short maturity of these instruments. Fair value is based on Level 1 or Level 2
inputs.
Marketable Securities – The carrying value of marketable securities in the financial statements is based on fair value. The
fair value of marketable securities is determined primarily based quoted prices for identical instruments or on quoted market
prices of similar financial assets. Fair value is based on Level 1 or Level 2 inputs.