HSBC 2012 Annual Report Download - page 96
Download and view the complete annual report
Please find page 96 of the 2012 HSBC annual report below. You can navigate through the pages in the report by either clicking on the pages listed below, or by using the keyword search tool below to find specific information within the annual report.-
 1
1 -
2
-
3
-
4
-
5
-
6
-
7
-
8
-
9
-
10
-
11
-
12
-
13
-
14
-
15
-
16
-
17
-
18
-
19
-
20
-
21
-
22
-
23
-
24
-
25
-
26
-
27
-
28
-
29
-
30
-
31
-
32
-
33
-
34
-
35
-
36
-
37
-
38
-
39
-
40
-
41
-
42
-
43
-
44
-
45
-
46
-
47
-
48
-
49
-
50
-
51
-
52
-
53
-
54
-
55
-
56
-
57
-
58
-
59
-
60
-
61
-
62
-
63
-
64
-
65
-
66
-
67
-
68
-
69
-
70
-
71
-
72
-
73
-
74
-
75
-
76
-
77
-
78
-
79
-
80
-
81
-
82
-
83
-
84
-
85
-
 86
86 -
 87
87 -
 88
88 -
 89
89 -
 90
90 -
 91
91 -
 92
92 -
 93
93 -
 94
94 -
 95
95 -
 96
96 -
 97
97 -
 98
98 -
 99
99 -
 100
100 -
 101
101 -
 102
102 -
 103
103 -
 104
104 -
 105
105 -
 106
106 -
107
-
108
-
109
-
110
-
111
-
112
-
113
-
114
-
115
-
116
-
117
-
118
-
119
-
120
-
121
-
122
-
123
-
124
-
125
-
126
-
127
-
128
-
129
-
130
-
131
-
132
-
133
-
134
-
135
-
136
-
137
-
138
-
139
-
140
-
141
-
142
-
143
-
144
-
145
-
146
-
147
-
148
-
149
-
150
-
151
-
152
-
153
-
154
-
155
-
156
-
157
-
158
-
159
-
160
-
161
-
162
-
163
-
164
-
165
-
166
-
167
-
168
-
169
-
170
-
171
-
172
-
173
-
174
-
175
-
176
-
177
-
178
-
179
-
180
-
181
-
182
-
183
-
184
-
185
-
186
-
187
-
188
-
189
-
190
-
191
-
192
-
193
-
194
-
195
-
196
-
197
-
198
-
199
-
200
-
201
-
202
-
203
-
204
-
205
-
206
-
207
-
208
-
209
-
210
-
211
-
212
-
213
-
214
-
215
-
216
-
217
-
218
-
219
-
220
-
221
-
222
-
223
-
224
-
225
-
226
-
227
-
228
-
229
-
230
-
231
-
232
-
233
-
234
-
235
-
236
-
237
-
238
-
239
-
240
-
241
-
242
-
243
-
244
-
245
-
246
-
247
-
248
-
249
-
250
-
251
-
252
-
253
-
254
-
255
-
256
-
257
-
258
-
259
-
260
-
261
-
262
-
263
-
264
-
265
-
266
-
267
-
268
-
269
-
270
-
271
-
272
-
273
-
274
-
275
-
276
-
277
-
278
-
279
-
280
-
281
-
282
-
283
-
284
-
285
-
286
-
287
-
288
-
289
-
290
-
291
-
292
-
293
-
294
-
295
-
296
-
297
-
298
-
299
-
300
-
301
-
302
-
303
-
304
-
305
-
306
-
307
-
308
-
309
-
310
-
311
-
312
-
313
-
314
-
315
-
316
-
317
-
318
-
319
-
320
-
321
-
322
-
323
-
324
-
325
-
326
-
327
-
328
-
329
-
330
-
331
-
332
-
333
-
334
-
335
-
336
-
337
-
338
-
339
-
340
-
341
-
342
-
343
-
344
-
345
-
346
-
347
-
348
-
349
-
350
-
351
-
352
-
353
-
354
-
355
-
356
-
357
-
358
-
359
-
360
-
361
-
362
-
363
-
364
-
365
-
366
-
367
-
368
-
369
-
370
-
371
-
372
-
373
-
374
-
375
-
376
-
377
-
378
-
379
-
380
-
381
-
382
-
383
-
384
-
385
-
386
-
387
-
388
-
389
-
390
-
391
-
392
-
393
-
394
-
395
-
396
-
397
-
398
-
399
-
400
-
401
-
402
-
403
-
404
-
405
-
406
-
407
-
408
-
409
-
410
-
411
-
412
-
413
-
414
-
415
-
416
-
417
-
418
-
419
-
420
-
421
-
422
-
423
-
424
-
425
-
426
-
427
-
428
-
429
-
430
-
431
-
432
-
433
-
434
-
435
-
436
-
437
-
438
-
439
-
440
-
441
-
442
-
443
-
444
-
445
-
446
-
447
-
448
-
449
-
450
-
451
-
452
-
453
-
454
-
455
-
456
-
457
-
458
-
459
-
460
-
461
-
462
-
463
-
464
-
465
-
466
-
467
-
468
-
469
-
470
-
471
-
472
-
473
-
474
-
475
-
476
-
477
-
478
-
479
-
480
-
481
-
482
-
483
-
484
-
485
-
486
-
487
-
488
-
489
-
490
-
491
-
492
-
493
-
494
-
495
-
496
-
497
-
498
-
499
-
500
-
501
-
502
-
503
-
504
-
505
-
506
-
507
-
508
-
509
-
510
-
511
-
512
-
513
-
514
-
515
-
516
-
517
-
518
-
519
-
520
-
521
-
522
-
523
-
524
-
525
-
526
-
527
-
528
-
529
-
530
-
531
-
532
-
533
-
534
-
535
-
536
-
537
-
538
-
539
-
540
-
541
-
542
-
543
-
544
-
545
-
546
 |
 |

HSBC HOLDINGS PLC
Report of the Directors: Operating and Financial Review (continued)
Geographical regions > Rest of Asia-Pacific
94
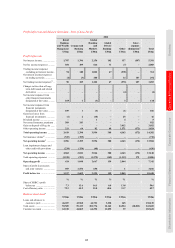
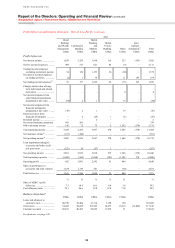
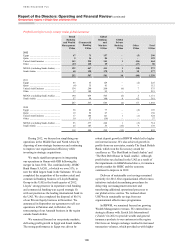
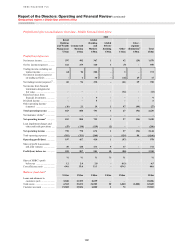
Profit/(loss) before tax by country within global businesses
Retail
Banking
and Wealth
Management
US$m
Commercial
Banking
US$m
Global
Banking
and
Markets
US$m
Global
Private
Banking
US$m
Other
US$m
Total
US$m
2012
Australia ............................................... 97 38 184 – (44) 275
India ..................................................... 41 89 497 7 175 809
Indonesia .............................................. 29 124 146 – 7 306
Mainland China ................................... 838 1,724 1,257 (4) 2,525 6,340
Ping An ............................................ 622 82 60 –2,459 3,223
Other associates ............................... 268 1,466 591 –– 2,325
Other mainland China ..................... (52) 176 606 (4) 66 792
Malaysia ............................................... 183 131 242 – 8 564
Singapore ............................................. 201 139 296 97 (65) 668
Taiwan ................................................. 62 36 136 – – 234
Vietnam................................................. 9 45 57 – 9 120
Other .................................................... 57 276 510 59 230 1,132
1,517 2,602 3,325 159 2,845 10,448
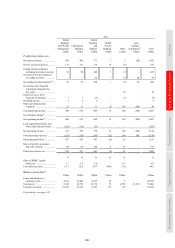
2011
Australia ............................................... 88 106 108 – 5 307
India ..................................................... (14) 122 539 5 161 813
Indonesia .............................................. 6 89 157 – 7 259
Mainland China ................................... 1,112 1,340 1,116 (4) 117 3,681
Ping An ............................................ 946 – 63 – 117 1,126
Other associates ............................... 233 1,150 466 – – 1,849
Other mainland China ..................... (67) 190 587 (4) – 706
Malaysia ............................................... 173 118 228 1 9 529
Singapore ............................................. 183 133 189 97 (7) 595
Taiwan ................................................. 45 23 130 – 12 210
Vietnam................................................. – 51 79 – 24 154
Other .................................................... 48 264 543 (8) 76 923
1,641 2,246 3,089 91 404 7,471
2010
Australia ............................................... 59 96 95 – 8 258
India ..................................................... (83) 71 508 4 179 679
Indonesia .............................................. 12 94 116 – (3) 219
Mainland China ................................... 839 833 683 (7) 217 2,565
Ping An ............................................ 797 – 51 – 188 1,036
Other associates ............................... 176 746 392 – – 1,314
Other mainland China ..................... (134) 87 240 (7) 29 215
Malaysia ............................................... 120 88 194 – (1) 401
Singapore ............................................. 169 87 100 84 84 524
Taiwan ................................................. 31 36 87 – (7) 147
Vietnam................................................. (7) 50 61 – 7 111
Other .................................................... 22 201 644 – 131 998
1,162 1,556 2,488 81 615 5,902
weaker external demand, the lagged effects of
monetary policy normalisation and the absence in
recent years of structural policies and infrastructure
investment playing a role in the slowdown.
Encouragingly, the government embarked on a
reform programme towards the end of the year
which helped lift sentiment and stabilise growth.
Growth in the Australian economy was uneven
in 2012 as it absorbed a mining boom which had the
effect of slowing investment in other sectors. For
2012 as a whole, growth was strong at around 3.5%.
Unemployment edged up to 5.4%. In response to
the global slowdown and to help re-balance growth
away from mining and towards the non-mining
sectors, the Reserve Bank of Australia reduced its
cash rate from 4.25% to 3.00%.
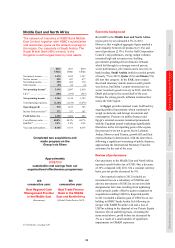
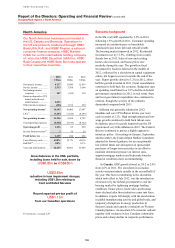
Review of performance
Our operations in the Rest of Asia-Pacific region
reported pre-tax profits of US$10.4bn compared
with US$7.5bn in 2011, an increase of 40% or
41% on a constant currency basis.