HSBC 2012 Annual Report Download - page 43
Download and view the complete annual report
Please find page 43 of the 2012 HSBC annual report below. You can navigate through the pages in the report by either clicking on the pages listed below, or by using the keyword search tool below to find specific information within the annual report.-
 1
1 -
2
-
3
-
4
-
5
-
6
-
7
-
8
-
9
-
10
-
11
-
12
-
13
-
14
-
15
-
16
-
17
-
18
-
19
-
20
-
21
-
22
-
23
-
24
-
25
-
26
-
27
-
28
-
29
-
30
-
31
-
32
-
 33
33 -
 34
34 -
 35
35 -
 36
36 -
 37
37 -
 38
38 -
 39
39 -
 40
40 -
 41
41 -
 42
42 -
 43
43 -
 44
44 -
 45
45 -
 46
46 -
 47
47 -
 48
48 -
 49
49 -
 50
50 -
 51
51 -
 52
52 -
 53
53 -
54
-
55
-
56
-
57
-
58
-
59
-
60
-
61
-
62
-
63
-
64
-
65
-
66
-
67
-
68
-
69
-
70
-
71
-
72
-
73
-
74
-
75
-
76
-
77
-
78
-
79
-
80
-
81
-
82
-
83
-
84
-
85
-
86
-
87
-
88
-
89
-
90
-
91
-
92
-
93
-
94
-
95
-
96
-
97
-
98
-
99
-
100
-
101
-
102
-
103
-
104
-
105
-
106
-
107
-
108
-
109
-
110
-
111
-
112
-
113
-
114
-
115
-
116
-
117
-
118
-
119
-
120
-
121
-
122
-
123
-
124
-
125
-
126
-
127
-
128
-
129
-
130
-
131
-
132
-
133
-
134
-
135
-
136
-
137
-
138
-
139
-
140
-
141
-
142
-
143
-
144
-
145
-
146
-
147
-
148
-
149
-
150
-
151
-
152
-
153
-
154
-
155
-
156
-
157
-
158
-
159
-
160
-
161
-
162
-
163
-
164
-
165
-
166
-
167
-
168
-
169
-
170
-
171
-
172
-
173
-
174
-
175
-
176
-
177
-
178
-
179
-
180
-
181
-
182
-
183
-
184
-
185
-
186
-
187
-
188
-
189
-
190
-
191
-
192
-
193
-
194
-
195
-
196
-
197
-
198
-
199
-
200
-
201
-
202
-
203
-
204
-
205
-
206
-
207
-
208
-
209
-
210
-
211
-
212
-
213
-
214
-
215
-
216
-
217
-
218
-
219
-
220
-
221
-
222
-
223
-
224
-
225
-
226
-
227
-
228
-
229
-
230
-
231
-
232
-
233
-
234
-
235
-
236
-
237
-
238
-
239
-
240
-
241
-
242
-
243
-
244
-
245
-
246
-
247
-
248
-
249
-
250
-
251
-
252
-
253
-
254
-
255
-
256
-
257
-
258
-
259
-
260
-
261
-
262
-
263
-
264
-
265
-
266
-
267
-
268
-
269
-
270
-
271
-
272
-
273
-
274
-
275
-
276
-
277
-
278
-
279
-
280
-
281
-
282
-
283
-
284
-
285
-
286
-
287
-
288
-
289
-
290
-
291
-
292
-
293
-
294
-
295
-
296
-
297
-
298
-
299
-
300
-
301
-
302
-
303
-
304
-
305
-
306
-
307
-
308
-
309
-
310
-
311
-
312
-
313
-
314
-
315
-
316
-
317
-
318
-
319
-
320
-
321
-
322
-
323
-
324
-
325
-
326
-
327
-
328
-
329
-
330
-
331
-
332
-
333
-
334
-
335
-
336
-
337
-
338
-
339
-
340
-
341
-
342
-
343
-
344
-
345
-
346
-
347
-
348
-
349
-
350
-
351
-
352
-
353
-
354
-
355
-
356
-
357
-
358
-
359
-
360
-
361
-
362
-
363
-
364
-
365
-
366
-
367
-
368
-
369
-
370
-
371
-
372
-
373
-
374
-
375
-
376
-
377
-
378
-
379
-
380
-
381
-
382
-
383
-
384
-
385
-
386
-
387
-
388
-
389
-
390
-
391
-
392
-
393
-
394
-
395
-
396
-
397
-
398
-
399
-
400
-
401
-
402
-
403
-
404
-
405
-
406
-
407
-
408
-
409
-
410
-
411
-
412
-
413
-
414
-
415
-
416
-
417
-
418
-
419
-
420
-
421
-
422
-
423
-
424
-
425
-
426
-
427
-
428
-
429
-
430
-
431
-
432
-
433
-
434
-
435
-
436
-
437
-
438
-
439
-
440
-
441
-
442
-
443
-
444
-
445
-
446
-
447
-
448
-
449
-
450
-
451
-
452
-
453
-
454
-
455
-
456
-
457
-
458
-
459
-
460
-
461
-
462
-
463
-
464
-
465
-
466
-
467
-
468
-
469
-
470
-
471
-
472
-
473
-
474
-
475
-
476
-
477
-
478
-
479
-
480
-
481
-
482
-
483
-
484
-
485
-
486
-
487
-
488
-
489
-
490
-
491
-
492
-
493
-
494
-
495
-
496
-
497
-
498
-
499
-
500
-
501
-
502
-
503
-
504
-
505
-
506
-
507
-
508
-
509
-
510
-
511
-
512
-
513
-
514
-
515
-
516
-
517
-
518
-
519
-
520
-
521
-
522
-
523
-
524
-
525
-
526
-
527
-
528
-
529
-
530
-
531
-
532
-
533
-
534
-
535
-
536
-
537
-
538
-
539
-
540
-
541
-
542
-
543
-
544
-
545
-
546
 |
 |

41
Overview Operating & Financial Review Corporate Governance Financial Statements Shareholder Information
contracts and investment and insurance contracts
with DPF.
The higher investment returns were largely the
result of positive equity market movements in 2012
compared with losses experienced during 2011
notably in Hong Kong, France and the UK. The gains
or losses on the financial assets designated at fair
value held to support these insurance and investment
contract liabilities are reported in ‘Net income from
financial instruments designated at fair value’.
The increase in liabilities to policyholders also
reflected the increase in new business written,
notably in Hong Kong and Brazil as explained under
‘Net earned insurance premiums’. This was partly
offset by a lower increase in reserves in France
attributable to the decline in net earned premiums,
and a decrease in Argentina due to the sale of the
general insurance business in May 2012.
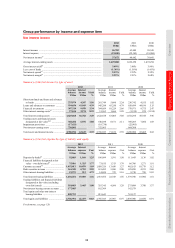
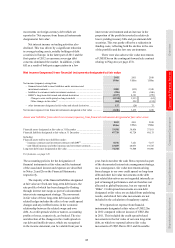
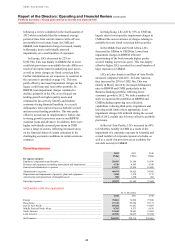
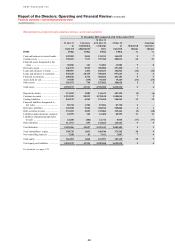
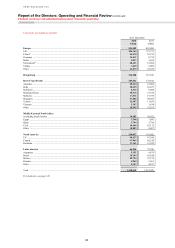
Loan impairment charges and other credit risk provisions
2012
US$m
2011
US$m
2010
US$m
Loan impairment charges
New allowances net of allowance releases ............................................................ 9,306 12,931 14,568
Recoveries of amounts previously written off ....................................................... (1,146) (1,426) (1,020)
8,160 11,505 13,548
Individually assessed allowances ............................................................................... 2,139 1,915 2,625
Collectively assessed allowances ............................................................................... 6,021 9,590 10,923
Impairment of available-for-sale debt securities ........................................................ 99 631 472
Other credit risk provisions/(recoveries) .................................................................... 52 (9) 19
Loan impairment charges and other credit risk provisions ........................................ 8,311 12,127 14,039
Reported loan impairment charges and other credit
risk provisions (‘LIC’s) fell from US$12bn to
US$8.3bn, a decrease of 31% compared with
2011. On an underlying basis they reduced from
US$10bn to US$8.0bn.
On a constant currency basis, they declined by
US$3.5bn or 30% compared with 2011. Collectively
assessed allowances were down by US$3.3bn and
credit risk provisions fell by US$456m, partly offset
by higher individually assessed impairment charges
of US$258m.
At 31 December 2012, the aggregate balance
of customer loan impairment allowances was
US$16bn. This represented 2% of gross loans
and advances to customers (net of reverse repos and
settlement accounts) in line with 31 December 2011.
The fall in collectively assessed impairment
allowances was most significant in RBWM in North
America due to the continued reduction in the CML
portfolios in run-off, and the sale of the Card and
Retail Services business. In addition, lower loan
impairment charges in Europe in RBWM were due
to improved credit quality as we continued to pro-
actively identify and monitor customers facing
financial hardship and focused our lending growth
on higher quality assets, notably in the UK. These
factors were partly offset by higher loan impairment
charges and other credit risk provisions in Latin
America which were driven by increased delinquency
rates in RBWM and CMB, mainly in Brazil.
Impairment of available-for-sale debt securities
reduced, mainly in Europe, due to lower charges on
available-for-sale ABSs and on Greek sovereign
debt, partly offset by an increase in Rest of Asia-
Pacific due to a charge on an available-for-sale debt
security in GB&M.
Individually assessed impairment allowances
increased by 14%, primarily in Europe in CMB,
reflecting challenging economic conditions in the
UK, Greece, Spain and Turkey. In addition, higher
individually assessed impairments in Latin America
mainly related to a single exposure in Brazil.
LICs declined in North America, primarily in
the CML portfolio, as well as in Europe, Hong Kong
and the Middle East and North Africa. The decrease
was partly offset by an increase in Latin America
and Rest of Asia-Pacific.
In North America, LICs fell by 51% to
US$3.5bn. Within this, loan impairment charges
fell by US$1.3bn following the sale of the Card
and Retail Services business. Loan impairment
charges in our CML business in the US fell by 48%
to US$2.6bn, driven by lower lending balances, as
we continued to run off the portfolio, and lower
delinquency levels. Loan impairment charges
continued to be adversely affected by delays in
expected cash flows from mortgage loans due, in
part, to delays in foreclosure processing, although
the effects were less pronounced than in 2011. These
decreases were partly offset by an adjustment made