HSBC 2012 Annual Report Download - page 221
Download and view the complete annual report
Please find page 221 of the 2012 HSBC annual report below. You can navigate through the pages in the report by either clicking on the pages listed below, or by using the keyword search tool below to find specific information within the annual report.-
 1
1 -
2
-
3
-
4
-
5
-
6
-
7
-
8
-
9
-
10
-
11
-
12
-
13
-
14
-
15
-
16
-
17
-
18
-
19
-
20
-
21
-
22
-
23
-
24
-
25
-
26
-
27
-
28
-
29
-
30
-
31
-
32
-
33
-
34
-
35
-
36
-
37
-
38
-
39
-
40
-
41
-
42
-
43
-
44
-
45
-
46
-
47
-
48
-
49
-
50
-
51
-
52
-
53
-
54
-
55
-
56
-
57
-
58
-
59
-
60
-
61
-
62
-
63
-
64
-
65
-
66
-
67
-
68
-
69
-
70
-
71
-
72
-
73
-
74
-
75
-
76
-
77
-
78
-
79
-
80
-
81
-
82
-
83
-
84
-
85
-
86
-
87
-
88
-
89
-
90
-
91
-
92
-
93
-
94
-
95
-
96
-
97
-
98
-
99
-
100
-
101
-
102
-
103
-
104
-
105
-
106
-
107
-
108
-
109
-
110
-
111
-
112
-
113
-
114
-
115
-
116
-
117
-
118
-
119
-
120
-
121
-
122
-
123
-
124
-
125
-
126
-
127
-
128
-
129
-
130
-
131
-
132
-
133
-
134
-
135
-
136
-
137
-
138
-
139
-
140
-
141
-
142
-
143
-
144
-
145
-
146
-
147
-
148
-
149
-
150
-
151
-
152
-
153
-
154
-
155
-
156
-
157
-
158
-
159
-
160
-
161
-
162
-
163
-
164
-
165
-
166
-
167
-
168
-
169
-
170
-
171
-
172
-
173
-
174
-
175
-
176
-
177
-
178
-
179
-
180
-
181
-
182
-
183
-
184
-
185
-
186
-
187
-
188
-
189
-
190
-
191
-
192
-
193
-
194
-
195
-
196
-
197
-
198
-
199
-
200
-
201
-
202
-
203
-
204
-
205
-
206
-
207
-
208
-
209
-
210
-
 211
211 -
 212
212 -
 213
213 -
 214
214 -
 215
215 -
 216
216 -
 217
217 -
 218
218 -
 219
219 -
 220
220 -
 221
221 -
 222
222 -
 223
223 -
 224
224 -
 225
225 -
 226
226 -
 227
227 -
 228
228 -
 229
229 -
 230
230 -
 231
231 -
232
-
233
-
234
-
235
-
236
-
237
-
238
-
239
-
240
-
241
-
242
-
243
-
244
-
245
-
246
-
247
-
248
-
249
-
250
-
251
-
252
-
253
-
254
-
255
-
256
-
257
-
258
-
259
-
260
-
261
-
262
-
263
-
264
-
265
-
266
-
267
-
268
-
269
-
270
-
271
-
272
-
273
-
274
-
275
-
276
-
277
-
278
-
279
-
280
-
281
-
282
-
283
-
284
-
285
-
286
-
287
-
288
-
289
-
290
-
291
-
292
-
293
-
294
-
295
-
296
-
297
-
298
-
299
-
300
-
301
-
302
-
303
-
304
-
305
-
306
-
307
-
308
-
309
-
310
-
311
-
312
-
313
-
314
-
315
-
316
-
317
-
318
-
319
-
320
-
321
-
322
-
323
-
324
-
325
-
326
-
327
-
328
-
329
-
330
-
331
-
332
-
333
-
334
-
335
-
336
-
337
-
338
-
339
-
340
-
341
-
342
-
343
-
344
-
345
-
346
-
347
-
348
-
349
-
350
-
351
-
352
-
353
-
354
-
355
-
356
-
357
-
358
-
359
-
360
-
361
-
362
-
363
-
364
-
365
-
366
-
367
-
368
-
369
-
370
-
371
-
372
-
373
-
374
-
375
-
376
-
377
-
378
-
379
-
380
-
381
-
382
-
383
-
384
-
385
-
386
-
387
-
388
-
389
-
390
-
391
-
392
-
393
-
394
-
395
-
396
-
397
-
398
-
399
-
400
-
401
-
402
-
403
-
404
-
405
-
406
-
407
-
408
-
409
-
410
-
411
-
412
-
413
-
414
-
415
-
416
-
417
-
418
-
419
-
420
-
421
-
422
-
423
-
424
-
425
-
426
-
427
-
428
-
429
-
430
-
431
-
432
-
433
-
434
-
435
-
436
-
437
-
438
-
439
-
440
-
441
-
442
-
443
-
444
-
445
-
446
-
447
-
448
-
449
-
450
-
451
-
452
-
453
-
454
-
455
-
456
-
457
-
458
-
459
-
460
-
461
-
462
-
463
-
464
-
465
-
466
-
467
-
468
-
469
-
470
-
471
-
472
-
473
-
474
-
475
-
476
-
477
-
478
-
479
-
480
-
481
-
482
-
483
-
484
-
485
-
486
-
487
-
488
-
489
-
490
-
491
-
492
-
493
-
494
-
495
-
496
-
497
-
498
-
499
-
500
-
501
-
502
-
503
-
504
-
505
-
506
-
507
-
508
-
509
-
510
-
511
-
512
-
513
-
514
-
515
-
516
-
517
-
518
-
519
-
520
-
521
-
522
-
523
-
524
-
525
-
526
-
527
-
528
-
529
-
530
-
531
-
532
-
533
-
534
-
535
-
536
-
537
-
538
-
539
-
540
-
541
-
542
-
543
-
544
-
545
-
546
 |
 |

219
Overview Operating & Financial Review Corporate Governance Financial Statements Shareholder Information
Market risk linkages to the accounting balance sheet
Trading assets and liabilities
The Group’s trading assets and liabilities are in substantially all
cases originated by GB&M. As described on page 393, the assets
and liabilities are classified as held for trading if they have been
acquired or incurred principally for the purpose of selling
or repurchasing in the near term, or form part of a portfolio of
identified financial instruments that are managed together and for
which there is evidence of a recent pattern of short-term profit-
taking. These assets and liabilities are treated as traded risk for the
purposes of market risk management, other than a limited number
of exceptions, primarily in Global Banking where the short-term
acquisition and disposal of the assets are linked to other non-
trading related activities such as loan origination.
Financial assets designated at fair value
Financial assets designated at fair value within HSBC are
predominantly held within the Insurance entities. The majority of
these assets are linked to policyholder liabilities for either unit-
linked or insurance and investment contracts with DPF. Further
information in respect of these assets is given on page 393. The
risks of these assets largely offset the market risk on the liabilities
under the policyholder contracts, and are risk managed on a non-
trading basis. Market risk for insurance operations is covered on
page 239.
Financial liabilities designated at fair value
Financial liabilities designated at fair value within HSBC are
primarily fixed-rate securities issued by HSBC entities for
funding purposes. As described on page 393, an accounting
mismatch would arise if the debt securities were accounted for
at amortised cost because the derivatives which economically
hedge market risks on the securities would be accounted for at
fair value with changes recognised in the income statement. The
market risks of these liabilities are treated as non-traded risk, the
principal risks being interest rate and/or foreign exchange risks.
We also incur liabilities to customers under investment contracts,
where the liabilities on unit-linked contracts are based on the fair
value of assets within the unit-linked funds. The exposures on
these funds are treated as non-traded risk and the principal risks
are those of the underlying assets in the funds.
Derivative assets and liabilities
As described in Note 19 on the Financial Statements HSBC
undertakes derivative activity for three primary purposes; to
create risk management solutions for clients, to manage the
portfolio risks arising from client business and to manage and
hedge HSBC’s own risks. Most of HSBC’s derivative exposures
arise from sales and trading activities within GB&M and are
treated as traded risk for market risk management purposes.
Within derivative assets and liabilities there are portfolios of
derivatives which are not risk managed on a trading intent basis
and are treated as non-traded risk for VAR measurement purposes.
These arise when the derivative was entered into in order to
manage risk arising from non-traded exposures. These include
non-qualifying hedging derivatives, and derivatives qualifying for
fair value and cash flow hedge accounting. The use of non-
qualifying hedges whose primary risks relate to interest rate and
foreign exchange exposure is described on page 397. Details of
derivatives in fair value and cash flow hedge accounting
relationships are given in Note 19 on the Financial Statements.
HSBC’s primary risks in respect of these instruments relate to
interest rate and foreign exchange risks.
Loans and advances to customers
The primary risk on assets within loans and advances to
customers is the credit risk of the borrower. The risk of these
assets is treated as non-trading risk for market risk management
purposes.
Financial investments
Financial investments include assets held on an available-for-sale
and held-to-maturity basis. An analysis of the Group’s holdings
of these securities by accounting classification and issuer type is
shown on page 457 and by business activity on page 20. The
majority of these securities are mainly held within Balance Sheet
Management in GB&M. The positions which are originated in
order to manage structural interest rate and liquidity risk are
treated as non-trading risk for the purposes of market risk
management. Available-for-sale security holdings within
insurance entities are treated as non-trading risk and are largely
held to back non-linked insurance policyholder liabilities. Market
risk for insurance operations is covered on page 239.
The other main holdings of available-for-sale assets are the
ABSs within GB&M’s legacy credit business, which are treated
as non-trading risk for market risk management purposes, the
principal risk being the credit risk of the obligor.
The Group’s held-to-maturity securities are principally held
within the Insurance business. Risks of held-to-maturity assets
are treated as non-trading for risk management purposes.
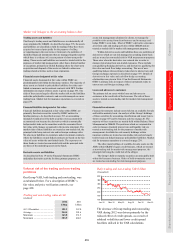
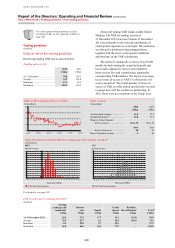
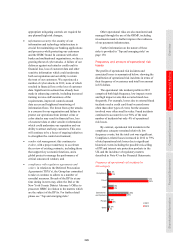
Value at risk of the trading and non-trading
portfolios
Our Group VAR, both trading and non-trading, was
as tabulated below. For a description of HSBC’s
fair value and price verification controls, see
page 438.
Trading and non-trading value at risk
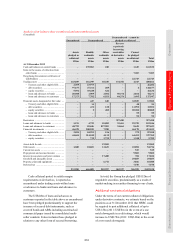
(Audited)
2012 2011
US$m US$m
At 31 December ....................... 181.3 367.0
Average .................................... 244.4 301.6
Minimum ................................. 163.8 231.5
Maximum ................................. 383.9 404.3
Daily trading and non-trading VAR (US$m)
(Unaudited)
100
150
200
250
300
350
400
Jan-12 Mar-12 May-12 Aug-12 Oct-12 Dec-12
The decrease of Group trading and non-trading
VAR during 2012 was driven primarily by the
reduced effect of credit spreads, as a result of
subdued volatilities and lower credit spread
baselines utilised in the VAR calculations.