HSBC 2012 Annual Report Download - page 156
Download and view the complete annual report
Please find page 156 of the 2012 HSBC annual report below. You can navigate through the pages in the report by either clicking on the pages listed below, or by using the keyword search tool below to find specific information within the annual report.-
 1
1 -
2
-
3
-
4
-
5
-
6
-
7
-
8
-
9
-
10
-
11
-
12
-
13
-
14
-
15
-
16
-
17
-
18
-
19
-
20
-
21
-
22
-
23
-
24
-
25
-
26
-
27
-
28
-
29
-
30
-
31
-
32
-
33
-
34
-
35
-
36
-
37
-
38
-
39
-
40
-
41
-
42
-
43
-
44
-
45
-
46
-
47
-
48
-
49
-
50
-
51
-
52
-
53
-
54
-
55
-
56
-
57
-
58
-
59
-
60
-
61
-
62
-
63
-
64
-
65
-
66
-
67
-
68
-
69
-
70
-
71
-
72
-
73
-
74
-
75
-
76
-
77
-
78
-
79
-
80
-
81
-
82
-
83
-
84
-
85
-
86
-
87
-
88
-
89
-
90
-
91
-
92
-
93
-
94
-
95
-
96
-
97
-
98
-
99
-
100
-
101
-
102
-
103
-
104
-
105
-
106
-
107
-
108
-
109
-
110
-
111
-
112
-
113
-
114
-
115
-
116
-
117
-
118
-
119
-
120
-
121
-
122
-
123
-
124
-
125
-
126
-
127
-
128
-
129
-
130
-
131
-
132
-
133
-
134
-
135
-
136
-
137
-
138
-
139
-
140
-
141
-
142
-
143
-
144
-
145
-
 146
146 -
 147
147 -
 148
148 -
 149
149 -
 150
150 -
 151
151 -
 152
152 -
 153
153 -
 154
154 -
 155
155 -
 156
156 -
 157
157 -
 158
158 -
 159
159 -
 160
160 -
 161
161 -
 162
162 -
 163
163 -
 164
164 -
 165
165 -
 166
166 -
167
-
168
-
169
-
170
-
171
-
172
-
173
-
174
-
175
-
176
-
177
-
178
-
179
-
180
-
181
-
182
-
183
-
184
-
185
-
186
-
187
-
188
-
189
-
190
-
191
-
192
-
193
-
194
-
195
-
196
-
197
-
198
-
199
-
200
-
201
-
202
-
203
-
204
-
205
-
206
-
207
-
208
-
209
-
210
-
211
-
212
-
213
-
214
-
215
-
216
-
217
-
218
-
219
-
220
-
221
-
222
-
223
-
224
-
225
-
226
-
227
-
228
-
229
-
230
-
231
-
232
-
233
-
234
-
235
-
236
-
237
-
238
-
239
-
240
-
241
-
242
-
243
-
244
-
245
-
246
-
247
-
248
-
249
-
250
-
251
-
252
-
253
-
254
-
255
-
256
-
257
-
258
-
259
-
260
-
261
-
262
-
263
-
264
-
265
-
266
-
267
-
268
-
269
-
270
-
271
-
272
-
273
-
274
-
275
-
276
-
277
-
278
-
279
-
280
-
281
-
282
-
283
-
284
-
285
-
286
-
287
-
288
-
289
-
290
-
291
-
292
-
293
-
294
-
295
-
296
-
297
-
298
-
299
-
300
-
301
-
302
-
303
-
304
-
305
-
306
-
307
-
308
-
309
-
310
-
311
-
312
-
313
-
314
-
315
-
316
-
317
-
318
-
319
-
320
-
321
-
322
-
323
-
324
-
325
-
326
-
327
-
328
-
329
-
330
-
331
-
332
-
333
-
334
-
335
-
336
-
337
-
338
-
339
-
340
-
341
-
342
-
343
-
344
-
345
-
346
-
347
-
348
-
349
-
350
-
351
-
352
-
353
-
354
-
355
-
356
-
357
-
358
-
359
-
360
-
361
-
362
-
363
-
364
-
365
-
366
-
367
-
368
-
369
-
370
-
371
-
372
-
373
-
374
-
375
-
376
-
377
-
378
-
379
-
380
-
381
-
382
-
383
-
384
-
385
-
386
-
387
-
388
-
389
-
390
-
391
-
392
-
393
-
394
-
395
-
396
-
397
-
398
-
399
-
400
-
401
-
402
-
403
-
404
-
405
-
406
-
407
-
408
-
409
-
410
-
411
-
412
-
413
-
414
-
415
-
416
-
417
-
418
-
419
-
420
-
421
-
422
-
423
-
424
-
425
-
426
-
427
-
428
-
429
-
430
-
431
-
432
-
433
-
434
-
435
-
436
-
437
-
438
-
439
-
440
-
441
-
442
-
443
-
444
-
445
-
446
-
447
-
448
-
449
-
450
-
451
-
452
-
453
-
454
-
455
-
456
-
457
-
458
-
459
-
460
-
461
-
462
-
463
-
464
-
465
-
466
-
467
-
468
-
469
-
470
-
471
-
472
-
473
-
474
-
475
-
476
-
477
-
478
-
479
-
480
-
481
-
482
-
483
-
484
-
485
-
486
-
487
-
488
-
489
-
490
-
491
-
492
-
493
-
494
-
495
-
496
-
497
-
498
-
499
-
500
-
501
-
502
-
503
-
504
-
505
-
506
-
507
-
508
-
509
-
510
-
511
-
512
-
513
-
514
-
515
-
516
-
517
-
518
-
519
-
520
-
521
-
522
-
523
-
524
-
525
-
526
-
527
-
528
-
529
-
530
-
531
-
532
-
533
-
534
-
535
-
536
-
537
-
538
-
539
-
540
-
541
-
542
-
543
-
544
-
545
-
546
 |
 |

HSBC HOLDINGS PLC
Report of the Directors: Operating and Financial Review (continued)
Risk > Credit risk > Wholesale lending / Credit quality of financial instruments
154
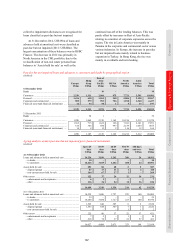
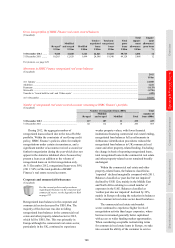
Corporate and commercial
Corporate and commercial lending, excluding
commercial real estate and other property-related
lending, increased from US$365bn at 31 December
2011 to US$400bn at 31 December 2012.
At 31 December 2012, this represented 39%
of total gross loans and advances to customers,
compared with 38% at 31 December 2011. The
growth was mainly in the international trade and
services sector, where balances mainly increased
in Europe despite muted demand for credit and, in
Hong Kong, driven by growth in trade finance
volumes as we capitalised on trade and capital flows.
In the manufacturing sector, balances increased in
Europe due to growth in the UK of overdraft balances
and corresponding customer accounts which did not
meet netting criteria under accounting rules.
The aggregate of our commercial real estate
and other property-related lending was US$117bn
at 31 December 2012, 3% higher than at 31 December
2011, representing 12% of total loans and advances to
customers. This growth was mainly in Hong Kong,
where demand for funds remained strong despite a
degree of market stabilisation after a sustained period
of buoyancy in the property investment and property
development sectors. Commercial real estate and
other property-related lending also grew in North
America due to an increase in originations in
commercial mortgages, which reflected our continued
focus on expanding our core offering to gain a larger
presence in key growth markets, including the West
Coast, Southeast and Midwest of the US.
For information on refinancing in commercial
real estate lending, see page 128.
Financial (non-bank)
Financial (non-bank) lending decreased from
US$86bn at 31 December 2011 to US$81bn at
31 December 2012. This was mainly in Europe due
to a decline in reverse repo activity, partly offset
by higher balances in North America, due to an
increase in reverse repo balances in Canada, and
in Hong Kong and Rest of Asia-Pacific, driven by
an increase in loans drawn by financial planning
companies, leasing companies and insurance
companies reflecting higher demand for funds
from a small number of corporates.
Loans and advances to banks
Loans and advances to banks decreased from
US$181bn at 31 December 2011 to US$153bn at
31 December 2012. This was mainly driven by
maturities and repayments in Hong Kong together
with a decline in reverse repos in Europe reflecting, in
part, the redeployment of liquidity to central banks.
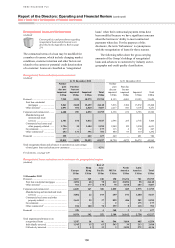
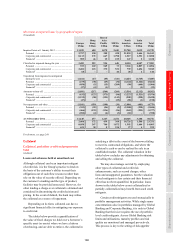
Credit quality of financial instruments
(Audited)
A summary of our current policies and
p
ractices regarding the credit quality of
f
inancial instruments is provided in the
Appendix to Risk on page 253.
The five classifications describing the credit
quality of our lending, debt securities portfolios
and derivatives are defined on page 253. Additional
credit quality information in respect of our
consolidated holdings of ABSs is provided
on page 259.
For the purpose of the following disclosure,
retail loans which are past due up to 89 days and are
not otherwise classified as impaired in accordance
with our disclosure convention (see page 253), are
not disclosed within the expected loss (‘EL’) grade
to which they relate, but are separately classified as
past due but not impaired.
2012 compared with 2011
(Unaudited)
We assess credit quality on all financial instruments
which are subject to credit risk, as shown in the table
on page 155. The balance of these financial
instruments was US$2,516bn at 31 December 2012,
an increase of 4% over 2011, of which US$1,690bn
or 67% was classified as ‘strong’. This percentage
declined marginally compared with 68% at
31 December 2011. The proportion of financial
instruments classified as ‘good’ remained broadly
stable at 16% and the proportion of ‘satisfactory’
balances increased marginally from 12% to 14%.
The proportion of ‘sub-standard’ financial
instruments remained low at 2% in both 2012
and 2011.
The proportion of trading assets classified as
‘strong’ declined from 75% to 65%. Overall trading
assets rose, largely in Europe, due to an increase in
holdings of debt securities from 2011’s subdued
levels which, coupled with the downgrading of
certain eurozone countries, resulted in an absolute
and relative increase in debt securities classified as
‘good’. In addition, holdings of ‘strong’ treasury and
other eligible bills fell both absolutely and relative to
the rest of trading assets primarily in Hong Kong due
to maturities without replacement of government
bonds, while increased levels of reverse repo and
stock lending balances with customers increased
the proportion of ‘good’ and ‘satisfactory’
classifications compared with ‘strong’.