HSBC 2012 Annual Report Download - page 106
Download and view the complete annual report
Please find page 106 of the 2012 HSBC annual report below. You can navigate through the pages in the report by either clicking on the pages listed below, or by using the keyword search tool below to find specific information within the annual report.-
 1
1 -
2
-
3
-
4
-
5
-
6
-
7
-
8
-
9
-
10
-
11
-
12
-
13
-
14
-
15
-
16
-
17
-
18
-
19
-
20
-
21
-
22
-
23
-
24
-
25
-
26
-
27
-
28
-
29
-
30
-
31
-
32
-
33
-
34
-
35
-
36
-
37
-
38
-
39
-
40
-
41
-
42
-
43
-
44
-
45
-
46
-
47
-
48
-
49
-
50
-
51
-
52
-
53
-
54
-
55
-
56
-
57
-
58
-
59
-
60
-
61
-
62
-
63
-
64
-
65
-
66
-
67
-
68
-
69
-
70
-
71
-
72
-
73
-
74
-
75
-
76
-
77
-
78
-
79
-
80
-
81
-
82
-
83
-
84
-
85
-
86
-
87
-
88
-
89
-
90
-
91
-
92
-
93
-
94
-
95
-
 96
96 -
 97
97 -
 98
98 -
 99
99 -
 100
100 -
 101
101 -
 102
102 -
 103
103 -
 104
104 -
 105
105 -
 106
106 -
 107
107 -
 108
108 -
 109
109 -
 110
110 -
 111
111 -
 112
112 -
 113
113 -
 114
114 -
 115
115 -
 116
116 -
117
-
118
-
119
-
120
-
121
-
122
-
123
-
124
-
125
-
126
-
127
-
128
-
129
-
130
-
131
-
132
-
133
-
134
-
135
-
136
-
137
-
138
-
139
-
140
-
141
-
142
-
143
-
144
-
145
-
146
-
147
-
148
-
149
-
150
-
151
-
152
-
153
-
154
-
155
-
156
-
157
-
158
-
159
-
160
-
161
-
162
-
163
-
164
-
165
-
166
-
167
-
168
-
169
-
170
-
171
-
172
-
173
-
174
-
175
-
176
-
177
-
178
-
179
-
180
-
181
-
182
-
183
-
184
-
185
-
186
-
187
-
188
-
189
-
190
-
191
-
192
-
193
-
194
-
195
-
196
-
197
-
198
-
199
-
200
-
201
-
202
-
203
-
204
-
205
-
206
-
207
-
208
-
209
-
210
-
211
-
212
-
213
-
214
-
215
-
216
-
217
-
218
-
219
-
220
-
221
-
222
-
223
-
224
-
225
-
226
-
227
-
228
-
229
-
230
-
231
-
232
-
233
-
234
-
235
-
236
-
237
-
238
-
239
-
240
-
241
-
242
-
243
-
244
-
245
-
246
-
247
-
248
-
249
-
250
-
251
-
252
-
253
-
254
-
255
-
256
-
257
-
258
-
259
-
260
-
261
-
262
-
263
-
264
-
265
-
266
-
267
-
268
-
269
-
270
-
271
-
272
-
273
-
274
-
275
-
276
-
277
-
278
-
279
-
280
-
281
-
282
-
283
-
284
-
285
-
286
-
287
-
288
-
289
-
290
-
291
-
292
-
293
-
294
-
295
-
296
-
297
-
298
-
299
-
300
-
301
-
302
-
303
-
304
-
305
-
306
-
307
-
308
-
309
-
310
-
311
-
312
-
313
-
314
-
315
-
316
-
317
-
318
-
319
-
320
-
321
-
322
-
323
-
324
-
325
-
326
-
327
-
328
-
329
-
330
-
331
-
332
-
333
-
334
-
335
-
336
-
337
-
338
-
339
-
340
-
341
-
342
-
343
-
344
-
345
-
346
-
347
-
348
-
349
-
350
-
351
-
352
-
353
-
354
-
355
-
356
-
357
-
358
-
359
-
360
-
361
-
362
-
363
-
364
-
365
-
366
-
367
-
368
-
369
-
370
-
371
-
372
-
373
-
374
-
375
-
376
-
377
-
378
-
379
-
380
-
381
-
382
-
383
-
384
-
385
-
386
-
387
-
388
-
389
-
390
-
391
-
392
-
393
-
394
-
395
-
396
-
397
-
398
-
399
-
400
-
401
-
402
-
403
-
404
-
405
-
406
-
407
-
408
-
409
-
410
-
411
-
412
-
413
-
414
-
415
-
416
-
417
-
418
-
419
-
420
-
421
-
422
-
423
-
424
-
425
-
426
-
427
-
428
-
429
-
430
-
431
-
432
-
433
-
434
-
435
-
436
-
437
-
438
-
439
-
440
-
441
-
442
-
443
-
444
-
445
-
446
-
447
-
448
-
449
-
450
-
451
-
452
-
453
-
454
-
455
-
456
-
457
-
458
-
459
-
460
-
461
-
462
-
463
-
464
-
465
-
466
-
467
-
468
-
469
-
470
-
471
-
472
-
473
-
474
-
475
-
476
-
477
-
478
-
479
-
480
-
481
-
482
-
483
-
484
-
485
-
486
-
487
-
488
-
489
-
490
-
491
-
492
-
493
-
494
-
495
-
496
-
497
-
498
-
499
-
500
-
501
-
502
-
503
-
504
-
505
-
506
-
507
-
508
-
509
-
510
-
511
-
512
-
513
-
514
-
515
-
516
-
517
-
518
-
519
-
520
-
521
-
522
-
523
-
524
-
525
-
526
-
527
-
528
-
529
-
530
-
531
-
532
-
533
-
534
-
535
-
536
-
537
-
538
-
539
-
540
-
541
-
542
-
543
-
544
-
545
-
546
 |
 |

HSBC HOLDINGS PLC
Report of the Directors: Operating and Financial Review (continued)
Geographical regions > North America
104
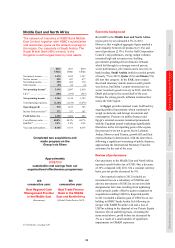
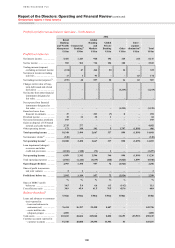
North America
Our North American businesses are located in
the US, Canada and Bermuda. Operations in
the US are primarily conducted through HSBC
Bank USA, N.A., and HSBC Finance, a national
consumer finance company. HSBC Markets
(USA) Inc. is the intermediate holding company
of, inter alia, HSBC Securities (USA) Inc. HSBC
Bank Canada and HSBC Bank Bermuda operate
in their respective countries.
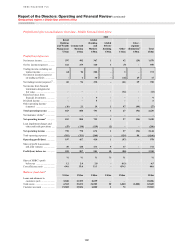
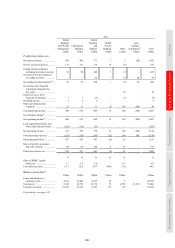
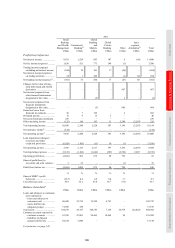
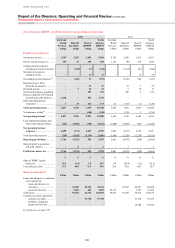
2012 2011 2010
US$m US$m US$m
Net interest income .......... 8,117 11,480 12,439
Net fee income ................. 2,513 3,308 3,664
Net trading income/
(expense) ....................... 507 (362) 314
Gains on disposals of US
branch network and
cards business ................ 4,012 – –
Other income/(expense) ... (456) 1,574 630
Net operating income21 .. 14,693 16,000 17,047
LICs76 ............................... (3,457) (7,016) (8,295)
Net operating income .... 11,236 8,984 8,752
Total operating expenses . (8,940) (8,919) (8,322)
Operating profit ............. 2,296 65 430
Income from associates77 .. 3 35 24
Profit before tax ............. 2,299 100 454
Cost efficiency ratio ........ 60.8% 55.7% 48.8%
RoRWA66 ......................... 0.8% – 0.1%
Year-end staff numbers ... 22,443 30,981 33,865
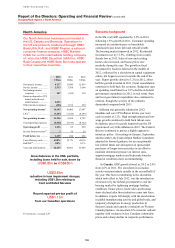
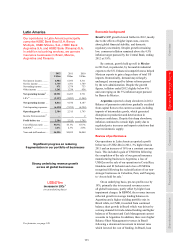
Gross balances in the CML portfolio,
including loans held for sale, down by
US$6.8bn to US$43bn
US$3.6bn
reduction in loan impairment charges,
including US$1.3bn relating to
Card and Retail Services
Record reported pre-tax profit of
US$1.1bn
from our Canadian operations
For footnotes, see page 120.
Economic background
In the US, real GDP expanded by 2.2% in 2012,
following 1.8% growth in 2011. Consumer spending
increased at a moderate pace as households
continued to pay down debt and rebuild wealth.
The housing market improved in 2012. Residential
investment rose by 11.9%, climbing from a multi-
decade low in 2011. Sales of new and existing
homes also increased, and house prices rose
modestly during the year. The growth in fixed
investment by business faltered in the middle of
2012, evidenced by a slowdown in capital equipment
orders, but began to recover towards the end of the
year. Export growth slowed to 3.2% in 2012, about
half the growth recorded in 2011. Fiscal consolidation
continued to hold back the economy. Budgetary caps
on spending contributed to a 2.2% decline in federal
government expenditure in 2012, in real terms. State
and local government expenditure also continued to
contract, though the severity of the cutbacks
diminished compared with 2011.
Inflation was generally subdued in 2012.
Headline and core CPI inflation for the year were
each recorded at 2.1%. High unemployment and low
wage growth continued to hold back labour costs.
In addition, prices for goods imported into the US
experienced very little inflation in 2012. The Federal
Reserve continued to pursue a highly supportive
monetary policy. At meetings in January, September,
and December, the Federal Open Market Committee
adjusted its forward guidance for an exceptionally
low federal funds rate and agreed on open-ended
purchases of longer-term securities in an effort to
maintain downward pressure on interest rates,
support mortgage markets and help make broader
financial conditions more accommodating.
In Canada, GDP growth slowed in 2012 to 2.0%
from 2.6% in 2011. The slowdown in economic
activity was particularly notable in the second half of
the year. One factor contributing to the slowdown,
which took effect in July 2012, was the introduction
of measures by the federal government to cool the
housing market by tightening mortgage lending
conditions. House prices, home sales and housing
starts declined after those initiatives came into force.
In addition, exports fell sharply with the deceleration
in global manufacturing activity and global trade, and
temporary disruptions in energy production in
Eastern Canada and capacity constraints on Western
Canada pipelines. An uncertain US economic outlook
together with weakness in key Canadian commodity
prices and a sharp decline in corporate performance