HSBC 2012 Annual Report Download - page 41
Download and view the complete annual report
Please find page 41 of the 2012 HSBC annual report below. You can navigate through the pages in the report by either clicking on the pages listed below, or by using the keyword search tool below to find specific information within the annual report.-
 1
1 -
2
-
3
-
4
-
5
-
6
-
7
-
8
-
9
-
10
-
11
-
12
-
13
-
14
-
15
-
16
-
17
-
18
-
19
-
20
-
21
-
22
-
23
-
24
-
25
-
26
-
27
-
28
-
29
-
30
-
 31
31 -
 32
32 -
 33
33 -
 34
34 -
 35
35 -
 36
36 -
 37
37 -
 38
38 -
 39
39 -
 40
40 -
 41
41 -
 42
42 -
 43
43 -
 44
44 -
 45
45 -
 46
46 -
 47
47 -
 48
48 -
 49
49 -
 50
50 -
 51
51 -
52
-
53
-
54
-
55
-
56
-
57
-
58
-
59
-
60
-
61
-
62
-
63
-
64
-
65
-
66
-
67
-
68
-
69
-
70
-
71
-
72
-
73
-
74
-
75
-
76
-
77
-
78
-
79
-
80
-
81
-
82
-
83
-
84
-
85
-
86
-
87
-
88
-
89
-
90
-
91
-
92
-
93
-
94
-
95
-
96
-
97
-
98
-
99
-
100
-
101
-
102
-
103
-
104
-
105
-
106
-
107
-
108
-
109
-
110
-
111
-
112
-
113
-
114
-
115
-
116
-
117
-
118
-
119
-
120
-
121
-
122
-
123
-
124
-
125
-
126
-
127
-
128
-
129
-
130
-
131
-
132
-
133
-
134
-
135
-
136
-
137
-
138
-
139
-
140
-
141
-
142
-
143
-
144
-
145
-
146
-
147
-
148
-
149
-
150
-
151
-
152
-
153
-
154
-
155
-
156
-
157
-
158
-
159
-
160
-
161
-
162
-
163
-
164
-
165
-
166
-
167
-
168
-
169
-
170
-
171
-
172
-
173
-
174
-
175
-
176
-
177
-
178
-
179
-
180
-
181
-
182
-
183
-
184
-
185
-
186
-
187
-
188
-
189
-
190
-
191
-
192
-
193
-
194
-
195
-
196
-
197
-
198
-
199
-
200
-
201
-
202
-
203
-
204
-
205
-
206
-
207
-
208
-
209
-
210
-
211
-
212
-
213
-
214
-
215
-
216
-
217
-
218
-
219
-
220
-
221
-
222
-
223
-
224
-
225
-
226
-
227
-
228
-
229
-
230
-
231
-
232
-
233
-
234
-
235
-
236
-
237
-
238
-
239
-
240
-
241
-
242
-
243
-
244
-
245
-
246
-
247
-
248
-
249
-
250
-
251
-
252
-
253
-
254
-
255
-
256
-
257
-
258
-
259
-
260
-
261
-
262
-
263
-
264
-
265
-
266
-
267
-
268
-
269
-
270
-
271
-
272
-
273
-
274
-
275
-
276
-
277
-
278
-
279
-
280
-
281
-
282
-
283
-
284
-
285
-
286
-
287
-
288
-
289
-
290
-
291
-
292
-
293
-
294
-
295
-
296
-
297
-
298
-
299
-
300
-
301
-
302
-
303
-
304
-
305
-
306
-
307
-
308
-
309
-
310
-
311
-
312
-
313
-
314
-
315
-
316
-
317
-
318
-
319
-
320
-
321
-
322
-
323
-
324
-
325
-
326
-
327
-
328
-
329
-
330
-
331
-
332
-
333
-
334
-
335
-
336
-
337
-
338
-
339
-
340
-
341
-
342
-
343
-
344
-
345
-
346
-
347
-
348
-
349
-
350
-
351
-
352
-
353
-
354
-
355
-
356
-
357
-
358
-
359
-
360
-
361
-
362
-
363
-
364
-
365
-
366
-
367
-
368
-
369
-
370
-
371
-
372
-
373
-
374
-
375
-
376
-
377
-
378
-
379
-
380
-
381
-
382
-
383
-
384
-
385
-
386
-
387
-
388
-
389
-
390
-
391
-
392
-
393
-
394
-
395
-
396
-
397
-
398
-
399
-
400
-
401
-
402
-
403
-
404
-
405
-
406
-
407
-
408
-
409
-
410
-
411
-
412
-
413
-
414
-
415
-
416
-
417
-
418
-
419
-
420
-
421
-
422
-
423
-
424
-
425
-
426
-
427
-
428
-
429
-
430
-
431
-
432
-
433
-
434
-
435
-
436
-
437
-
438
-
439
-
440
-
441
-
442
-
443
-
444
-
445
-
446
-
447
-
448
-
449
-
450
-
451
-
452
-
453
-
454
-
455
-
456
-
457
-
458
-
459
-
460
-
461
-
462
-
463
-
464
-
465
-
466
-
467
-
468
-
469
-
470
-
471
-
472
-
473
-
474
-
475
-
476
-
477
-
478
-
479
-
480
-
481
-
482
-
483
-
484
-
485
-
486
-
487
-
488
-
489
-
490
-
491
-
492
-
493
-
494
-
495
-
496
-
497
-
498
-
499
-
500
-
501
-
502
-
503
-
504
-
505
-
506
-
507
-
508
-
509
-
510
-
511
-
512
-
513
-
514
-
515
-
516
-
517
-
518
-
519
-
520
-
521
-
522
-
523
-
524
-
525
-
526
-
527
-
528
-
529
-
530
-
531
-
532
-
533
-
534
-
535
-
536
-
537
-
538
-
539
-
540
-
541
-
542
-
543
-
544
-
545
-
546
 |
 |

39
Overview Operating & Financial Review Corporate Governance Financial Statements Shareholder Information
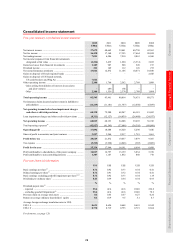
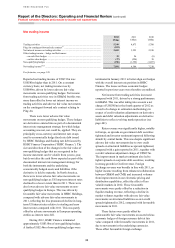
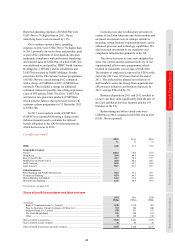
Net earned insurance premiums were broadly
in line with 2011 on a reported basis. On a
constant currency basis net earned premiums
increased by 6%.
The rise in net earned premium income was
driven by Hong Kong and Latin America. In Hong
Kong, sales of insurance contracts increased, in
particular deferred annuity products, as we widened
our product offerings to fulfil customers’ long-term
savings and retirement needs, supported by
successful marketing campaigns. Renewal premiums
from both unit-linked and insurance contracts with
DPF also increased reflecting strong sales in previous
years. The increase in net earned premiums in Latin
America was due to higher sales of unit-linked and
term life products in Brazil, reflecting customer
appetite for life insurance products. It was partly
offset by a decrease in net earned premiums
following the sale of the general insurance business
in Argentina in May 2012. In Europe, net earned
premiums decreased, mainly on investment contracts
with DPF in France, as a result of the uncertain
economic and political environment in the election
year and increased product competition. The non-
renewal and transfer to third parties of certain
contracts in our Irish business during 2011 also
contributed to the decline. This was partly offset by a
rise in net earned premiums in the UK due, in part, to
the sale of a unit-linked insurance product through
two new third party platforms.
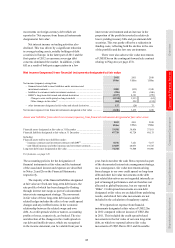
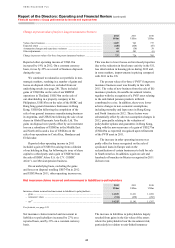
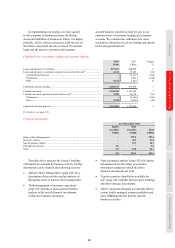
Gains on disposal of US branch network, US cards business and Ping An
2012
US$m
2011
US$m
2010
US$m
Gains on disposal of US branch network ................................................................... 864 – –
Gains on disposal of US cards business ..................................................................... 3,148 – –
Gains on disposal of Ping An ..................................................................................... 3,012 – –
Total ............................................................................................................................ 7,024 – –
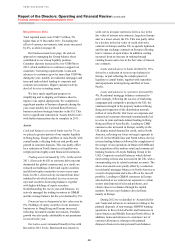
Significant progress was made in 2012 in exiting
non-strategic markets and disposing of businesses
and investments not aligned with the Group’s long-
term strategy. These included three major disposals:
• In May 2012, HSBC USA Inc., HSBC Finance
and HSBC Technology and Services (USA) Inc.
sold their US Card and Retail Services business
to Capital One Financial Corporation, realising a
gain on sale of US$3.1bn.
• In May 2012, HSBC Bank USA, N.A. (‘HSBC
Bank USA’) sold 138 out of 195 branches
primarily in upstate New York to First Niagara
Bank, realising a gain of US$661m. In August
2012, it sold the remaining 57 branches to the
same purchaser, realising a gain of US$203m.
• In December 2012, HSBC Insurance Holdings
Limited and The Hongkong and Shanghai
Banking Corporation agreed to sell to indirect
wholly-owned subsidiaries of Charoen
Pokphand Group Company Limited their entire
shareholdings in Ping An, representing 15.57%
of the issued share capital of Ping An, in two
tranches. The first tranche was completed
on 7 December 2012. The completion of the
second tranche took place on 6 February 2013.
The disposal of this associate resulted in a gain
of US$3.0bn in 2012 (see page 472). Our
remaining shareholding has been classified as a
financial investment.
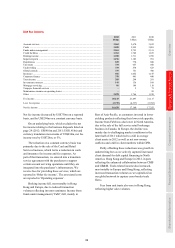
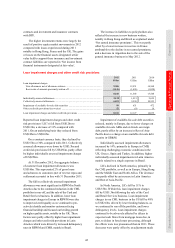
Other operating income
2012
US$m
2011
US$m
2010
US$m
Rent received .............................................................................................................. 210 217 535
Gains/(losses) recognised on assets held for sale ....................................................... 485 55 (263)
Valuation gains on investment properties .................................................................. 72 118 93
Gain on disposal of property, plant and equipment, intangible assets and
non-financial investments ...................................................................................... 187 57 701
Gains arising from dilution of interests in associates and joint ventures .................. – 208 188
Change in present value of in-force long-term insurance business ........................... 737 726 705
Other ........................................................................................................................... 409 385 603
Other operating income .............................................................................................. 2,100 1,766 2,562