HSBC 2007 Annual Report Download - page 80
Download and view the complete annual report
Please find page 80 of the 2007 HSBC annual report below. You can navigate through the pages in the report by either clicking on the pages listed below, or by using the keyword search tool below to find specific information within the annual report.-
 1
1 -
2
-
3
-
4
-
5
-
6
-
7
-
8
-
9
-
10
-
11
-
12
-
13
-
14
-
15
-
16
-
17
-
18
-
19
-
20
-
21
-
22
-
23
-
24
-
25
-
26
-
27
-
28
-
29
-
30
-
31
-
32
-
33
-
34
-
35
-
36
-
37
-
38
-
39
-
40
-
41
-
42
-
43
-
44
-
45
-
46
-
47
-
48
-
49
-
50
-
51
-
52
-
53
-
54
-
55
-
56
-
57
-
58
-
59
-
60
-
61
-
62
-
63
-
64
-
65
-
66
-
67
-
68
-
69
-
 70
70 -
 71
71 -
 72
72 -
 73
73 -
 74
74 -
 75
75 -
 76
76 -
 77
77 -
 78
78 -
 79
79 -
 80
80 -
 81
81 -
 82
82 -
 83
83 -
 84
84 -
 85
85 -
 86
86 -
 87
87 -
 88
88 -
 89
89 -
 90
90 -
91
-
92
-
93
-
94
-
95
-
96
-
97
-
98
-
99
-
100
-
101
-
102
-
103
-
104
-
105
-
106
-
107
-
108
-
109
-
110
-
111
-
112
-
113
-
114
-
115
-
116
-
117
-
118
-
119
-
120
-
121
-
122
-
123
-
124
-
125
-
126
-
127
-
128
-
129
-
130
-
131
-
132
-
133
-
134
-
135
-
136
-
137
-
138
-
139
-
140
-
141
-
142
-
143
-
144
-
145
-
146
-
147
-
148
-
149
-
150
-
151
-
152
-
153
-
154
-
155
-
156
-
157
-
158
-
159
-
160
-
161
-
162
-
163
-
164
-
165
-
166
-
167
-
168
-
169
-
170
-
171
-
172
-
173
-
174
-
175
-
176
-
177
-
178
-
179
-
180
-
181
-
182
-
183
-
184
-
185
-
186
-
187
-
188
-
189
-
190
-
191
-
192
-
193
-
194
-
195
-
196
-
197
-
198
-
199
-
200
-
201
-
202
-
203
-
204
-
205
-
206
-
207
-
208
-
209
-
210
-
211
-
212
-
213
-
214
-
215
-
216
-
217
-
218
-
219
-
220
-
221
-
222
-
223
-
224
-
225
-
226
-
227
-
228
-
229
-
230
-
231
-
232
-
233
-
234
-
235
-
236
-
237
-
238
-
239
-
240
-
241
-
242
-
243
-
244
-
245
-
246
-
247
-
248
-
249
-
250
-
251
-
252
-
253
-
254
-
255
-
256
-
257
-
258
-
259
-
260
-
261
-
262
-
263
-
264
-
265
-
266
-
267
-
268
-
269
-
270
-
271
-
272
-
273
-
274
-
275
-
276
-
277
-
278
-
279
-
280
-
281
-
282
-
283
-
284
-
285
-
286
-
287
-
288
-
289
-
290
-
291
-
292
-
293
-
294
-
295
-
296
-
297
-
298
-
299
-
300
-
301
-
302
-
303
-
304
-
305
-
306
-
307
-
308
-
309
-
310
-
311
-
312
-
313
-
314
-
315
-
316
-
317
-
318
-
319
-
320
-
321
-
322
-
323
-
324
-
325
-
326
-
327
-
328
-
329
-
330
-
331
-
332
-
333
-
334
-
335
-
336
-
337
-
338
-
339
-
340
-
341
-
342
-
343
-
344
-
345
-
346
-
347
-
348
-
349
-
350
-
351
-
352
-
353
-
354
-
355
-
356
-
357
-
358
-
359
-
360
-
361
-
362
-
363
-
364
-
365
-
366
-
367
-
368
-
369
-
370
-
371
-
372
-
373
-
374
-
375
-
376
-
377
-
378
-
379
-
380
-
381
-
382
-
383
-
384
-
385
-
386
-
387
-
388
-
389
-
390
-
391
-
392
-
393
-
394
-
395
-
396
-
397
-
398
-
399
-
400
-
401
-
402
-
403
-
404
-
405
-
406
-
407
-
408
-
409
-
410
-
411
-
412
-
413
-
414
-
415
-
416
-
417
-
418
-
419
-
420
-
421
-
422
-
423
-
424
-
425
-
426
-
427
-
428
-
429
-
430
-
431
-
432
-
433
-
434
-
435
-
436
-
437
-
438
-
439
-
440
-
441
-
442
-
443
-
444
-
445
-
446
-
447
-
448
-
449
-
450
-
451
-
452
-
453
-
454
-
455
-
456
-
457
-
458
-
459
-
460
-
461
-
462
-
463
-
464
-
465
-
466
-
467
-
468
-
469
-
470
-
471
-
472
-
473
-
474
-
475
-
476
 |
 |

HSBC HOLDINGS PLC
Report of the Directors: Business Review (continued)
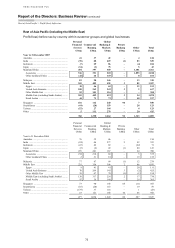
Rest of Asia-Pacific > 2007
78
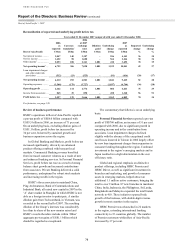
increased use of point-of-sale financing. By the
end of 2007, nearly 2.7 million credit cards were in
circulation in India and over 1.2 million cards in the
Middle East. In Malaysia, the Group is the third
largest card issuer. Spreads in the region improved
slightly due to lower funding costs.
The mortgage business in each market in
Asia-Pacific was affected to varying degrees by
competitive pressures on balances and margins,
and by local regulatory requirements. Excluding
Australia and New Zealand, which were affected by
the portfolio sales, mortgage balances grew by 7 per
cent. In the Middle East, mortgage balances more
than doubled.
Net fee income rose by 40 per cent to
US$766 million, with increases from most products,
notably cards and the wealth management businesses.
Increased sales of unit trusts and other
investment products across the region was a key
driver of higher fee income. Funds under
management rose by 57 per cent. In the Middle East,
retail sales benefited from the strong performance of
local markets (largely due to sustained higher oil
prices), and improved volumes of key products.
Strong investment sales were recorded in India,
South Korea, Singapore and mainland China, where
HSBC offered residents renminbi-denominated
products through its QDII offerings.
Credit card fee income increased, primarily in
the Middle East, India, the Philippines and Malaysia,
due to a combination of additional cards in
circulation, increased spending and higher balances.
Distribution capabilities for insurance products
were expanded through strategic alliances and the
addition of new branches. In addition, marketing
campaigns promoted HSBC’s expertise in life and
non-life products. As a result, insurance fees and new
premiums rose by 170 per cent and 50 per cent
respectively. The improved and extended sales
management in the Middle East, Taiwan and India
increased fees from the distribution of insurance
products.
Loan impairment charges and other credit risk
provisions declined by 1 per cent. Loan impairment
charges were significantly lower in Taiwan due to the
non-recurrence of regulatory measures which, in
2006, had led to an increase in loan impairment
charges. In Indonesia, lower impairment charges
were a result of an improved economic environment
and continued collection efforts. The Middle East
businesses benefited from lower delinquencies and
better collections.
In India, higher loan impairment charges were
due to volume growth of the portfolio, along with a
change in the collection methods of staff and
agencies and regulatory restrictions on collections.
Loan impairment charges in Malaysia also increased.
In Thailand, loan impairment charges rose from a
previously low level, partly because of the one-off
effect of a regulatory increase during the year in the
minimum payment due on credit cards.
Ongoing expansion in the region led to increases
in headcount and performance-related staff costs,
particularly in mainland China and the Middle East,
which contributed to a 27 per cent increase in
operating expenses to US$2.1 billion. Staff numbers
rose from 750 to over 2,000 in mainland China,
primarily in new branches. In India, an additional
700 employees were added to drive business
expansion, bringing the total to over 4,600.
Additional staff in the Middle East were concentrated
in the UAE, where the number of employees
increased from nearly 1,200 to 1,500, reflecting
investment in the region.
Investment expenditure during 2007 was focused
on implementing new business initiatives in
consumer finance, HSBC Direct and expansion in
mainland China. In India, the consumer finance
branch network and the credit card business were
expanded. In Indonesia, HSBC added 36 consumer
finance loan centres. In mainland China, key cities
were identified for increased investment and a total
of 27 new branches and sub-branches were opened.
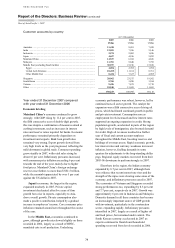
Income from HSBC’s strategic investments in its
associates increased by 45 per cent, predominantly
due to an increased contribution from Ping An
Insurance, which experienced steady growth in its
key business segments as well as improved
investment returns. In the Middle East, Saudi British
Bank’s performance was lower than in 2006, as the
local stock market did not reach the volume of
activity seen in that year.
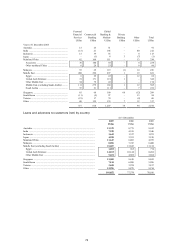
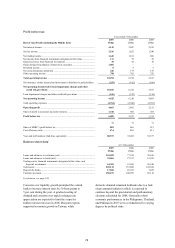
Commercial Banking reported a profit before
tax of US$1.4 billion, 27 per cent higher than in
2006. The region’s economies performed strongly,
and this generated excellent trade and investment
flows. The launch of secure and enhanced online
banking services, and new International Banking
Centres established to support the increase in the
customer base, contributed to strengthened deposit
growth. Costs rose to fund investment in expansion
in mainland China and India, initiatives directed at
small and medium-sized businesses in selected
countries and additional employee numbers to
support this planned growth. The cost efficiency ratio
was largely in line with 2006.