HSBC 2007 Annual Report Download - page 29
Download and view the complete annual report
Please find page 29 of the 2007 HSBC annual report below. You can navigate through the pages in the report by either clicking on the pages listed below, or by using the keyword search tool below to find specific information within the annual report.-
 1
1 -
2
-
3
-
4
-
5
-
6
-
7
-
8
-
9
-
10
-
11
-
12
-
13
-
14
-
15
-
16
-
17
-
18
-
 19
19 -
 20
20 -
 21
21 -
 22
22 -
 23
23 -
 24
24 -
 25
25 -
 26
26 -
 27
27 -
 28
28 -
 29
29 -
 30
30 -
 31
31 -
 32
32 -
 33
33 -
 34
34 -
 35
35 -
 36
36 -
 37
37 -
 38
38 -
 39
39 -
40
-
41
-
42
-
43
-
44
-
45
-
46
-
47
-
48
-
49
-
50
-
51
-
52
-
53
-
54
-
55
-
56
-
57
-
58
-
59
-
60
-
61
-
62
-
63
-
64
-
65
-
66
-
67
-
68
-
69
-
70
-
71
-
72
-
73
-
74
-
75
-
76
-
77
-
78
-
79
-
80
-
81
-
82
-
83
-
84
-
85
-
86
-
87
-
88
-
89
-
90
-
91
-
92
-
93
-
94
-
95
-
96
-
97
-
98
-
99
-
100
-
101
-
102
-
103
-
104
-
105
-
106
-
107
-
108
-
109
-
110
-
111
-
112
-
113
-
114
-
115
-
116
-
117
-
118
-
119
-
120
-
121
-
122
-
123
-
124
-
125
-
126
-
127
-
128
-
129
-
130
-
131
-
132
-
133
-
134
-
135
-
136
-
137
-
138
-
139
-
140
-
141
-
142
-
143
-
144
-
145
-
146
-
147
-
148
-
149
-
150
-
151
-
152
-
153
-
154
-
155
-
156
-
157
-
158
-
159
-
160
-
161
-
162
-
163
-
164
-
165
-
166
-
167
-
168
-
169
-
170
-
171
-
172
-
173
-
174
-
175
-
176
-
177
-
178
-
179
-
180
-
181
-
182
-
183
-
184
-
185
-
186
-
187
-
188
-
189
-
190
-
191
-
192
-
193
-
194
-
195
-
196
-
197
-
198
-
199
-
200
-
201
-
202
-
203
-
204
-
205
-
206
-
207
-
208
-
209
-
210
-
211
-
212
-
213
-
214
-
215
-
216
-
217
-
218
-
219
-
220
-
221
-
222
-
223
-
224
-
225
-
226
-
227
-
228
-
229
-
230
-
231
-
232
-
233
-
234
-
235
-
236
-
237
-
238
-
239
-
240
-
241
-
242
-
243
-
244
-
245
-
246
-
247
-
248
-
249
-
250
-
251
-
252
-
253
-
254
-
255
-
256
-
257
-
258
-
259
-
260
-
261
-
262
-
263
-
264
-
265
-
266
-
267
-
268
-
269
-
270
-
271
-
272
-
273
-
274
-
275
-
276
-
277
-
278
-
279
-
280
-
281
-
282
-
283
-
284
-
285
-
286
-
287
-
288
-
289
-
290
-
291
-
292
-
293
-
294
-
295
-
296
-
297
-
298
-
299
-
300
-
301
-
302
-
303
-
304
-
305
-
306
-
307
-
308
-
309
-
310
-
311
-
312
-
313
-
314
-
315
-
316
-
317
-
318
-
319
-
320
-
321
-
322
-
323
-
324
-
325
-
326
-
327
-
328
-
329
-
330
-
331
-
332
-
333
-
334
-
335
-
336
-
337
-
338
-
339
-
340
-
341
-
342
-
343
-
344
-
345
-
346
-
347
-
348
-
349
-
350
-
351
-
352
-
353
-
354
-
355
-
356
-
357
-
358
-
359
-
360
-
361
-
362
-
363
-
364
-
365
-
366
-
367
-
368
-
369
-
370
-
371
-
372
-
373
-
374
-
375
-
376
-
377
-
378
-
379
-
380
-
381
-
382
-
383
-
384
-
385
-
386
-
387
-
388
-
389
-
390
-
391
-
392
-
393
-
394
-
395
-
396
-
397
-
398
-
399
-
400
-
401
-
402
-
403
-
404
-
405
-
406
-
407
-
408
-
409
-
410
-
411
-
412
-
413
-
414
-
415
-
416
-
417
-
418
-
419
-
420
-
421
-
422
-
423
-
424
-
425
-
426
-
427
-
428
-
429
-
430
-
431
-
432
-
433
-
434
-
435
-
436
-
437
-
438
-
439
-
440
-
441
-
442
-
443
-
444
-
445
-
446
-
447
-
448
-
449
-
450
-
451
-
452
-
453
-
454
-
455
-
456
-
457
-
458
-
459
-
460
-
461
-
462
-
463
-
464
-
465
-
466
-
467
-
468
-
469
-
470
-
471
-
472
-
473
-
474
-
475
-
476
 |
 |

27
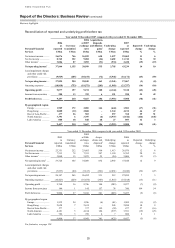
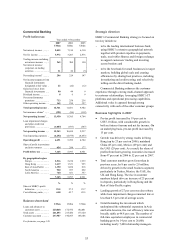
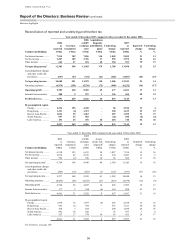
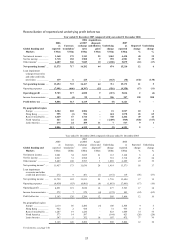
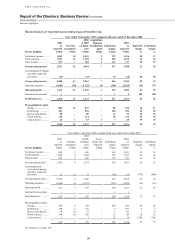
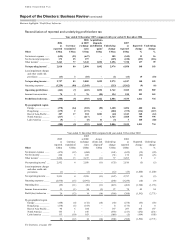
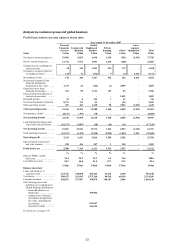
Reconciliation of reported and underlying profit before tax
Year ended 31 December 2007 compared with year ended 31 December 2006
Global Banking and
Markets
2006
as
reported
US$m
Currency
translation1
US$m
2006
at 2007
exchange
rates
US$m
Acquisitions,
disposals
and dilution
gains2
US$m
Underlying
change
US$m
2007
as
reported
US$m
Reported
change
%
Underlying
change
%
Net interest income .......... 3,168 175 3,343 25 1,062 4,430 40 32
Net fee income ................. 3,718 182 3,900 9 992 4,901 32 25
Other income3 .................. 6,689 360 7,049 10 (1,180) 5,879 (12) (17)
Net operating income4 ... 13,575 717 14,292 44 874 15,210 12 6
Loan impairment
(charges)/recoveries
and other credit risk
provisions .................... 119 6 125 – (163) (38) (132) (130)
Net operating income .... 13,694 723 14,417 44 711 15,172 11 5
Operating expenses .......... (7,991) (406) (8,397) (35) (926) (9,358) (17) (11)
Operating profit ............. 5,703 317 6,020 9 (215) 5,814 2 (4)
Income from associates ... 103 (4) 99 2 206 307 198 208
Profit before tax ............. 5,806 313 6,119 11 (9) 6,121 5 –
By geographical region
Europe ......................... 2,304 202 2,506 – 21 2,527 10 1
Hong Kong .................. 955 (1) 954 – 624 1,578 65 65
Rest of Asia-Pacific ..... 1,649 67 1,716 – 748 2,464 49 44
North America ............. 423 21 444 – (1,409) (965) (328) (317)
Latin America .............. 475 24 499 11 7 517 9 1
5,806 313 6,119 11 (9) 6,121 5 –
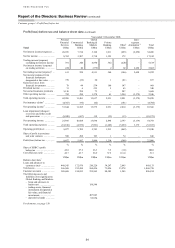
Year ended 31 December 2006 compared with year ended 31 December 2005
Global Banking and
Markets
2005
as
reported
US$m
Currency
translation1
US$m
2005
at 2006
exchange
rates
US$m
Acqui-
sitions and
disposals2
US$m
Underlying
change
US$m
2006
as
reported
US$m
Reported
change
%
Underlying
change
%
Net interest income .......... 3,001 34 3,035 21 112 3,168 6 4
Net fee income ................. 2,967 31 2,998 2 718 3,718 25 24
Other income3 .................. 5,489 108 5,597 3 1,089 6,689 22 19
Net operating income4 ..... 11,457 173 11,630 26 1,919 13,575 18 17
Loan impairment
recoveries and other
credit risk provisions ... 272 9 281 (1) (161) 119 (56) (57)
Net operating income ...... 11,729 182 11,911 25 1,758 13,694 17 15
Operating expenses .......... (6,838) (63) (6,901) (9) (1,081) (7,991) (17) (16)
Operating profit ............... 4,891 119 5,010 16 677 5,703 17 14
Income from associates ... 272 7 279 (4) (172) 103 (62) (62)
Profit before tax .............. 5,163 126 5,289 12 505 5,806 12 10
By geographical region
Europe ......................... 2,114 86 2,200 (4) 108 2,304 9 5
Hong Kong .................. 922 2 924 – 31 955 4 3
Rest of Asia-Pacific ..... 1,207 19 1,226 – 423 1,649 37 35
North America ............. 573 14 587 – (164) 423 (26) (28)
Latin America .............. 347 5 352 16 107 475 37 30
5,163 126 5,289 12 505 5,806 12 10
For footnotes, see page 130.