HSBC 2007 Annual Report Download - page 282
Download and view the complete annual report
Please find page 282 of the 2007 HSBC annual report below. You can navigate through the pages in the report by either clicking on the pages listed below, or by using the keyword search tool below to find specific information within the annual report.-
 1
1 -
2
-
3
-
4
-
5
-
6
-
7
-
8
-
9
-
10
-
11
-
12
-
13
-
14
-
15
-
16
-
17
-
18
-
19
-
20
-
21
-
22
-
23
-
24
-
25
-
26
-
27
-
28
-
29
-
30
-
31
-
32
-
33
-
34
-
35
-
36
-
37
-
38
-
39
-
40
-
41
-
42
-
43
-
44
-
45
-
46
-
47
-
48
-
49
-
50
-
51
-
52
-
53
-
54
-
55
-
56
-
57
-
58
-
59
-
60
-
61
-
62
-
63
-
64
-
65
-
66
-
67
-
68
-
69
-
70
-
71
-
72
-
73
-
74
-
75
-
76
-
77
-
78
-
79
-
80
-
81
-
82
-
83
-
84
-
85
-
86
-
87
-
88
-
89
-
90
-
91
-
92
-
93
-
94
-
95
-
96
-
97
-
98
-
99
-
100
-
101
-
102
-
103
-
104
-
105
-
106
-
107
-
108
-
109
-
110
-
111
-
112
-
113
-
114
-
115
-
116
-
117
-
118
-
119
-
120
-
121
-
122
-
123
-
124
-
125
-
126
-
127
-
128
-
129
-
130
-
131
-
132
-
133
-
134
-
135
-
136
-
137
-
138
-
139
-
140
-
141
-
142
-
143
-
144
-
145
-
146
-
147
-
148
-
149
-
150
-
151
-
152
-
153
-
154
-
155
-
156
-
157
-
158
-
159
-
160
-
161
-
162
-
163
-
164
-
165
-
166
-
167
-
168
-
169
-
170
-
171
-
172
-
173
-
174
-
175
-
176
-
177
-
178
-
179
-
180
-
181
-
182
-
183
-
184
-
185
-
186
-
187
-
188
-
189
-
190
-
191
-
192
-
193
-
194
-
195
-
196
-
197
-
198
-
199
-
200
-
201
-
202
-
203
-
204
-
205
-
206
-
207
-
208
-
209
-
210
-
211
-
212
-
213
-
214
-
215
-
216
-
217
-
218
-
219
-
220
-
221
-
222
-
223
-
224
-
225
-
226
-
227
-
228
-
229
-
230
-
231
-
232
-
233
-
234
-
235
-
236
-
237
-
238
-
239
-
240
-
241
-
242
-
243
-
244
-
245
-
246
-
247
-
248
-
249
-
250
-
251
-
252
-
253
-
254
-
255
-
256
-
257
-
258
-
259
-
260
-
261
-
262
-
263
-
264
-
265
-
266
-
267
-
268
-
269
-
270
-
271
-
 272
272 -
 273
273 -
 274
274 -
 275
275 -
 276
276 -
 277
277 -
 278
278 -
 279
279 -
 280
280 -
 281
281 -
 282
282 -
 283
283 -
 284
284 -
 285
285 -
 286
286 -
 287
287 -
 288
288 -
 289
289 -
 290
290 -
 291
291 -
 292
292 -
293
-
294
-
295
-
296
-
297
-
298
-
299
-
300
-
301
-
302
-
303
-
304
-
305
-
306
-
307
-
308
-
309
-
310
-
311
-
312
-
313
-
314
-
315
-
316
-
317
-
318
-
319
-
320
-
321
-
322
-
323
-
324
-
325
-
326
-
327
-
328
-
329
-
330
-
331
-
332
-
333
-
334
-
335
-
336
-
337
-
338
-
339
-
340
-
341
-
342
-
343
-
344
-
345
-
346
-
347
-
348
-
349
-
350
-
351
-
352
-
353
-
354
-
355
-
356
-
357
-
358
-
359
-
360
-
361
-
362
-
363
-
364
-
365
-
366
-
367
-
368
-
369
-
370
-
371
-
372
-
373
-
374
-
375
-
376
-
377
-
378
-
379
-
380
-
381
-
382
-
383
-
384
-
385
-
386
-
387
-
388
-
389
-
390
-
391
-
392
-
393
-
394
-
395
-
396
-
397
-
398
-
399
-
400
-
401
-
402
-
403
-
404
-
405
-
406
-
407
-
408
-
409
-
410
-
411
-
412
-
413
-
414
-
415
-
416
-
417
-
418
-
419
-
420
-
421
-
422
-
423
-
424
-
425
-
426
-
427
-
428
-
429
-
430
-
431
-
432
-
433
-
434
-
435
-
436
-
437
-
438
-
439
-
440
-
441
-
442
-
443
-
444
-
445
-
446
-
447
-
448
-
449
-
450
-
451
-
452
-
453
-
454
-
455
-
456
-
457
-
458
-
459
-
460
-
461
-
462
-
463
-
464
-
465
-
466
-
467
-
468
-
469
-
470
-
471
-
472
-
473
-
474
-
475
-
476
 |
 |

HSBC HOLDINGS PLC
Report of the Directors: The Management of Risk (continued)
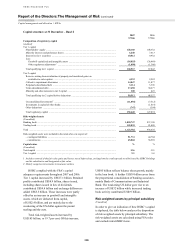
Insurance operations > PVIF
280
Present value of in-force long-term
insurance business
(Audited)
The HSBC life insurance business is accounted for
using the embedded value approach, which, inter
alia, provides a comprehensive framework for the
evaluation of insurance and related risks. The present
value of the in-force long-term (‘PVIF’) asset at
31 December 2007 was US$2.0 billion (2006:
US$1.5 billion). The present value of the
shareholders’ interest in the profits expected to
emerge from the book of in-force policies at
31 December can be stress-tested to assess the ability
of the life business book to withstand adverse
developments. A key feature of the life insurance
business is the importance of managing the assets,
liabilities and risks in a coordinated fashion rather
than individually. This reflects the greater
interdependence of these three elements for life
insurance than is generally the case for non-life
insurance.
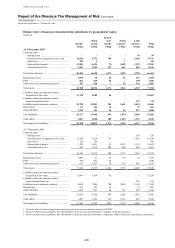
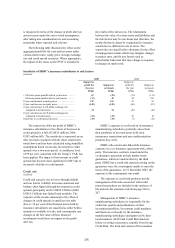
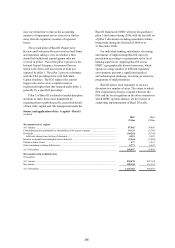
The following table shows the effect on the
PVIF of reasonably possible changes in the main
economic assumptions, changes in the risk-free
and risk discount rates, across all insurance
manufacturing subsidiaries.
It should be noted that, due to certain conditions
that may exist within the contracts, the effects may
be non-linear and so the results of the stress-testing
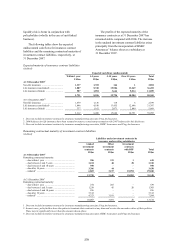
Sensitivity of PVIF to changes in economic
assumptions
(Audited)
PVIF at 31 December
2007 2006
US$m US$m
+ 100 basis point shift in
risk-free rate .............. 195 130
– 100 basis point shift in
risk-free rate .............. (232) (141)
+ 100 basis point shift in
risk discount rate ....... (95) (64)
– 100 basis point shift in
risk discount rate ....... 106 70
disclosed may not be extrapolated to higher levels of
stress. In calculating the various scenarios, all other
assumptions are held stable except for testing the
effect of the shift in the risk-free rate, when
consequential changes to investment returns, risk
discount rates and bonus rates are also incorporated.
The sensitivities shown are before actions that could
be taken by management to mitigate effects and
before consequential changes in policyholder
behaviour.
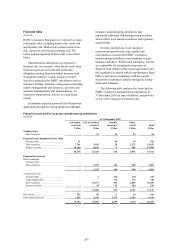
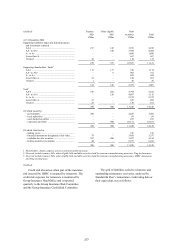
The following table shows the movements
recorded during the year in respect of PVIF and the
net assets of insurance operations:
Movements in PVIF and net assets of insurance operations
(Audited)
2007 2006
PVIF
Net assets
of insurance
operations Total PVIF
Net assets
of insurance
operations
Total
US$m US$m US$m US$m US$m US$m
At 1 January ........................................................ 1,549 4,400 5,949 1,400 3,582 4,982
Value of new business written during the year1 . 380 – 380 254 – 254
Acquisitions of subsidiaries/portfolios ............... 390 262 652 – – –
Movements arising from in-force business:
– expected return ............................................ (175) – (175) (233) – (233)
– experience variances2 .................................. 53 – 53 31 – 31
– change in operating assumptions ................ (86) – (86) (17) – (17)
Investment return variances ................................ – – – 13 – 13
Changes in investment assumptions ................... 4 – 4 3 – 3
Return on net assets ............................................ – 1,235 1,235 – 752 752
Disposals of subsidiaries/portfolios ................... – (250) (250) – – –
Exchange differences and other ......................... (150) 59 (91) 98 95 193
Capital transactions ............................................ – 759 759 – (29) (29)
At 31 December .................................................. 1,965 6,465 8,430 1,549 4,400 5,949
1 Value of net new business during the year is the present value of the projected stream of profits from the business.
2 Experience variances include the effect of the difference between demographic, expense and persistency assumptions used in the
previous PVIF calculation and actual experience observed during the year.