HSBC 2007 Annual Report Download - page 148
Download and view the complete annual report
Please find page 148 of the 2007 HSBC annual report below. You can navigate through the pages in the report by either clicking on the pages listed below, or by using the keyword search tool below to find specific information within the annual report.-
 1
1 -
2
-
3
-
4
-
5
-
6
-
7
-
8
-
9
-
10
-
11
-
12
-
13
-
14
-
15
-
16
-
17
-
18
-
19
-
20
-
21
-
22
-
23
-
24
-
25
-
26
-
27
-
28
-
29
-
30
-
31
-
32
-
33
-
34
-
35
-
36
-
37
-
38
-
39
-
40
-
41
-
42
-
43
-
44
-
45
-
46
-
47
-
48
-
49
-
50
-
51
-
52
-
53
-
54
-
55
-
56
-
57
-
58
-
59
-
60
-
61
-
62
-
63
-
64
-
65
-
66
-
67
-
68
-
69
-
70
-
71
-
72
-
73
-
74
-
75
-
76
-
77
-
78
-
79
-
80
-
81
-
82
-
83
-
84
-
85
-
86
-
87
-
88
-
89
-
90
-
91
-
92
-
93
-
94
-
95
-
96
-
97
-
98
-
99
-
100
-
101
-
102
-
103
-
104
-
105
-
106
-
107
-
108
-
109
-
110
-
111
-
112
-
113
-
114
-
115
-
116
-
117
-
118
-
119
-
120
-
121
-
122
-
123
-
124
-
125
-
126
-
127
-
128
-
129
-
130
-
131
-
132
-
133
-
134
-
135
-
136
-
137
-
 138
138 -
 139
139 -
 140
140 -
 141
141 -
 142
142 -
 143
143 -
 144
144 -
 145
145 -
 146
146 -
 147
147 -
 148
148 -
 149
149 -
 150
150 -
 151
151 -
 152
152 -
 153
153 -
 154
154 -
 155
155 -
 156
156 -
 157
157 -
 158
158 -
159
-
160
-
161
-
162
-
163
-
164
-
165
-
166
-
167
-
168
-
169
-
170
-
171
-
172
-
173
-
174
-
175
-
176
-
177
-
178
-
179
-
180
-
181
-
182
-
183
-
184
-
185
-
186
-
187
-
188
-
189
-
190
-
191
-
192
-
193
-
194
-
195
-
196
-
197
-
198
-
199
-
200
-
201
-
202
-
203
-
204
-
205
-
206
-
207
-
208
-
209
-
210
-
211
-
212
-
213
-
214
-
215
-
216
-
217
-
218
-
219
-
220
-
221
-
222
-
223
-
224
-
225
-
226
-
227
-
228
-
229
-
230
-
231
-
232
-
233
-
234
-
235
-
236
-
237
-
238
-
239
-
240
-
241
-
242
-
243
-
244
-
245
-
246
-
247
-
248
-
249
-
250
-
251
-
252
-
253
-
254
-
255
-
256
-
257
-
258
-
259
-
260
-
261
-
262
-
263
-
264
-
265
-
266
-
267
-
268
-
269
-
270
-
271
-
272
-
273
-
274
-
275
-
276
-
277
-
278
-
279
-
280
-
281
-
282
-
283
-
284
-
285
-
286
-
287
-
288
-
289
-
290
-
291
-
292
-
293
-
294
-
295
-
296
-
297
-
298
-
299
-
300
-
301
-
302
-
303
-
304
-
305
-
306
-
307
-
308
-
309
-
310
-
311
-
312
-
313
-
314
-
315
-
316
-
317
-
318
-
319
-
320
-
321
-
322
-
323
-
324
-
325
-
326
-
327
-
328
-
329
-
330
-
331
-
332
-
333
-
334
-
335
-
336
-
337
-
338
-
339
-
340
-
341
-
342
-
343
-
344
-
345
-
346
-
347
-
348
-
349
-
350
-
351
-
352
-
353
-
354
-
355
-
356
-
357
-
358
-
359
-
360
-
361
-
362
-
363
-
364
-
365
-
366
-
367
-
368
-
369
-
370
-
371
-
372
-
373
-
374
-
375
-
376
-
377
-
378
-
379
-
380
-
381
-
382
-
383
-
384
-
385
-
386
-
387
-
388
-
389
-
390
-
391
-
392
-
393
-
394
-
395
-
396
-
397
-
398
-
399
-
400
-
401
-
402
-
403
-
404
-
405
-
406
-
407
-
408
-
409
-
410
-
411
-
412
-
413
-
414
-
415
-
416
-
417
-
418
-
419
-
420
-
421
-
422
-
423
-
424
-
425
-
426
-
427
-
428
-
429
-
430
-
431
-
432
-
433
-
434
-
435
-
436
-
437
-
438
-
439
-
440
-
441
-
442
-
443
-
444
-
445
-
446
-
447
-
448
-
449
-
450
-
451
-
452
-
453
-
454
-
455
-
456
-
457
-
458
-
459
-
460
-
461
-
462
-
463
-
464
-
465
-
466
-
467
-
468
-
469
-
470
-
471
-
472
-
473
-
474
-
475
-
476
 |
 |

HSBC HOLDINGS PLC
Report of the Directors: Financial Review (continued)
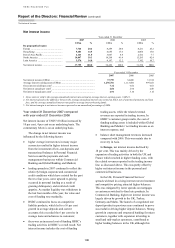
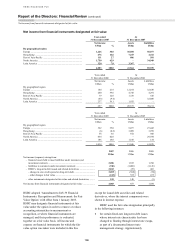
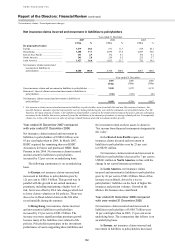
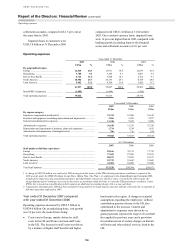
Net income from financial instruments designated at fair value
146
Net income from financial instruments designated at fair value
Year ended
31 December 2007
At
31 December 2007
Net income Assets Liabilities
US$m % US$m US$m
By geographical region
Europe ........................................................................................ 1,226 30.0 30,058 50,077
Hong Kong ................................................................................ 676 16.6 7,253 4,412
Rest of Asia-Pacific ................................................................... 111 2.7 886 501
North America ........................................................................... 1,750 42.9 – 34,949
Latin America ............................................................................ 320 7.8 3,367 –
4,083 100.0 41,564 89,939
Year ended
31 December 2006
At
31 December 2006
Net income Assets Liabilities
US$m % US$m US$m
By geographical region
Europe ........................................................................................ 144 21.9 12,164 32,630
Hong Kong ................................................................................ 260 39.6 4,745 4,291
Rest of Asia-Pacific ................................................................... 79 12.0 1,729 410
North America ........................................................................... (63) (9.6) – 32,880
Latin America ............................................................................ 237 36.1 1,935 –
657 100.0 20,573 70,211
Year ended
31 December 2005
At
31 December 2005
Net income Assets Liabilities
US$m % US$m US$m
By geographical region
Europe ........................................................................................ 362 35.0 9,077 27,442
Hong Kong ................................................................................ (6) (0.6) 3,909 3,999
Rest of Asia-Pacific ................................................................... 58 5.6 872 300
North America ........................................................................... 434 42.0 – 29,934
Latin America ............................................................................ 186 18.0 1,188 154
1,034 100.0 15,046 61,829
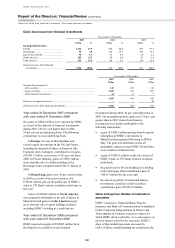
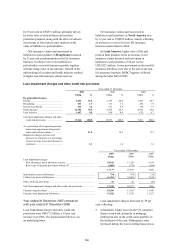
2007
US$m
2006
US$m
2005
US$m
Net income/(expense) arising from:
– financial assets held to meet liabilities under insurance and
investment contracts ................................................................................ 2,056 1,552 1,760
– liabilities to customers under investment contracts ................................ (940) (1,008) (1,126)
– HSBC’s long-term debt issued and related derivatives .......................... 2,812 (35) 403
– change in own credit spread on long-term debt ................................... 3,055 (388) (70)
– other changes in fair value ................................................................... (243) 353 473
– other instruments designated at fair value and related derivatives ......... 155 148 (3)
Net income from financial instruments designated at fair value .................... 4,083 657 1,034
HSBC adopted ‘Amendment to IAS 39 Financial
Instruments: Recognition and Measurement: the Fair
Value Option’ with effect from 1 January 2005.
HSBC may designate financial instruments at fair
value under the option in order to remove or reduce
accounting mismatches in measurement or
recognition, or where financial instruments are
managed, and their performance is evaluated,
together on a fair value basis. All income and
expense on financial instruments for which the fair
value option was taken were included in this line
except for issued debt securities and related
derivatives, where the interest components were
shown in interest expense.
HSBC used the fair value designation principally
in the following instances:
• for certain fixed-rate long-term debt issues
whose interest rate characteristic has been
changed to floating through interest rate swaps,
as part of a documented interest rate
management strategy. Approximately