HSBC 2007 Annual Report Download - page 114
Download and view the complete annual report
Please find page 114 of the 2007 HSBC annual report below. You can navigate through the pages in the report by either clicking on the pages listed below, or by using the keyword search tool below to find specific information within the annual report.-
 1
1 -
2
-
3
-
4
-
5
-
6
-
7
-
8
-
9
-
10
-
11
-
12
-
13
-
14
-
15
-
16
-
17
-
18
-
19
-
20
-
21
-
22
-
23
-
24
-
25
-
26
-
27
-
28
-
29
-
30
-
31
-
32
-
33
-
34
-
35
-
36
-
37
-
38
-
39
-
40
-
41
-
42
-
43
-
44
-
45
-
46
-
47
-
48
-
49
-
50
-
51
-
52
-
53
-
54
-
55
-
56
-
57
-
58
-
59
-
60
-
61
-
62
-
63
-
64
-
65
-
66
-
67
-
68
-
69
-
70
-
71
-
72
-
73
-
74
-
75
-
76
-
77
-
78
-
79
-
80
-
81
-
82
-
83
-
84
-
85
-
86
-
87
-
88
-
89
-
90
-
91
-
92
-
93
-
94
-
95
-
96
-
97
-
98
-
99
-
100
-
101
-
102
-
103
-
 104
104 -
 105
105 -
 106
106 -
 107
107 -
 108
108 -
 109
109 -
 110
110 -
 111
111 -
 112
112 -
 113
113 -
 114
114 -
 115
115 -
 116
116 -
 117
117 -
 118
118 -
 119
119 -
 120
120 -
 121
121 -
 122
122 -
 123
123 -
 124
124 -
125
-
126
-
127
-
128
-
129
-
130
-
131
-
132
-
133
-
134
-
135
-
136
-
137
-
138
-
139
-
140
-
141
-
142
-
143
-
144
-
145
-
146
-
147
-
148
-
149
-
150
-
151
-
152
-
153
-
154
-
155
-
156
-
157
-
158
-
159
-
160
-
161
-
162
-
163
-
164
-
165
-
166
-
167
-
168
-
169
-
170
-
171
-
172
-
173
-
174
-
175
-
176
-
177
-
178
-
179
-
180
-
181
-
182
-
183
-
184
-
185
-
186
-
187
-
188
-
189
-
190
-
191
-
192
-
193
-
194
-
195
-
196
-
197
-
198
-
199
-
200
-
201
-
202
-
203
-
204
-
205
-
206
-
207
-
208
-
209
-
210
-
211
-
212
-
213
-
214
-
215
-
216
-
217
-
218
-
219
-
220
-
221
-
222
-
223
-
224
-
225
-
226
-
227
-
228
-
229
-
230
-
231
-
232
-
233
-
234
-
235
-
236
-
237
-
238
-
239
-
240
-
241
-
242
-
243
-
244
-
245
-
246
-
247
-
248
-
249
-
250
-
251
-
252
-
253
-
254
-
255
-
256
-
257
-
258
-
259
-
260
-
261
-
262
-
263
-
264
-
265
-
266
-
267
-
268
-
269
-
270
-
271
-
272
-
273
-
274
-
275
-
276
-
277
-
278
-
279
-
280
-
281
-
282
-
283
-
284
-
285
-
286
-
287
-
288
-
289
-
290
-
291
-
292
-
293
-
294
-
295
-
296
-
297
-
298
-
299
-
300
-
301
-
302
-
303
-
304
-
305
-
306
-
307
-
308
-
309
-
310
-
311
-
312
-
313
-
314
-
315
-
316
-
317
-
318
-
319
-
320
-
321
-
322
-
323
-
324
-
325
-
326
-
327
-
328
-
329
-
330
-
331
-
332
-
333
-
334
-
335
-
336
-
337
-
338
-
339
-
340
-
341
-
342
-
343
-
344
-
345
-
346
-
347
-
348
-
349
-
350
-
351
-
352
-
353
-
354
-
355
-
356
-
357
-
358
-
359
-
360
-
361
-
362
-
363
-
364
-
365
-
366
-
367
-
368
-
369
-
370
-
371
-
372
-
373
-
374
-
375
-
376
-
377
-
378
-
379
-
380
-
381
-
382
-
383
-
384
-
385
-
386
-
387
-
388
-
389
-
390
-
391
-
392
-
393
-
394
-
395
-
396
-
397
-
398
-
399
-
400
-
401
-
402
-
403
-
404
-
405
-
406
-
407
-
408
-
409
-
410
-
411
-
412
-
413
-
414
-
415
-
416
-
417
-
418
-
419
-
420
-
421
-
422
-
423
-
424
-
425
-
426
-
427
-
428
-
429
-
430
-
431
-
432
-
433
-
434
-
435
-
436
-
437
-
438
-
439
-
440
-
441
-
442
-
443
-
444
-
445
-
446
-
447
-
448
-
449
-
450
-
451
-
452
-
453
-
454
-
455
-
456
-
457
-
458
-
459
-
460
-
461
-
462
-
463
-
464
-
465
-
466
-
467
-
468
-
469
-
470
-
471
-
472
-
473
-
474
-
475
-
476
 |
 |

HSBC HOLDINGS PLC
Report of the Directors: Business Review (continued)
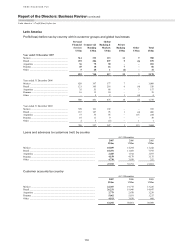
Latin America > 2007
112
consumer price inflation climbed to 4.5 per cent by
December 2007, mainly from higher food prices.
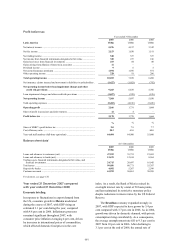
The cycle of monetary easing which began in the
third quarter of 2005 paused in October 2007 with
the overnight rate at 11.25 per cent, the lowest level
in several decades. After nine years of steady
expansion, the trade balance surplus fell slightly in
2007, and is expected to decrease further in 2008.
Balance of payments fundamentals, however,
remained robust and, as a result, the Brazilian
economy seemed less vulnerable to external shocks
than in previous years.
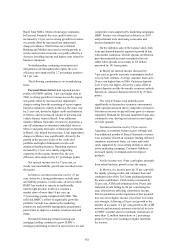
The Argentine economy also performed
strongly in 2007, with GDP expected to have risen
by 8.7 per cent. This strength was a consequence of
several factors such as a competitive exchange rate,
spare capacity in the economy and a generally
favourable external environment, which helped
Argentina extend its fiscal and external surpluses
into a fourth successive year. Less encouraging was
the fact that inflation accelerated to about 13 per
cent, up from 10 per cent in 2006. Although food
inflation was part of the explanation, rapid demand
growth was also a factor. 2007 was an election year,
and as a result the rate of growth of fiscal spending
doubled to 45 per cent on an annual basis. As a
consequence, the primary surplus fell by around
1.2 per cent of GDP.
Throughout the region as a whole, GDP growth
roughly matched that of 2006. The slowdown in
Mexico provided a contrast to better performances
elsewhere in Central and Southern America. Central
America grew by an estimated 6.3 per cent, up from
5.9 per cent in 2006 while, in South America, growth
was an estimated 5.8 per cent, up from 5.3 per cent
in 2006. The most dynamic economies in Central
America were Panama (10.0 per cent growth in
GDP) and the Dominican Republic (8.0 per cent),
followed by Costa Rica (6.2 per cent) and Honduras
(6.2 per cent). In South America, the fastest growing
countries after Argentina were Peru (7.2 per cent
growth in GDP), Venezuela (7.0 per cent) and
Colombia (6.5 per cent). In general, inflation appears
to be under control in Latin America, averaging
around 5 per cent over the past three years. Only
Venezuela and Argentina have experienced double-
digit inflation, while the US dollar-based economies
of Panama, Ecuador and El Salvador have better
inflationary records.
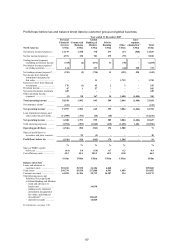
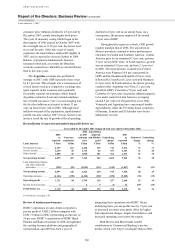
Reconciliation of reported and underlying profit before tax
Year ended 31 December 2007 compared with year ended 31 December 2006
Latin America
2006
as
reported
US$m
Currency
translation1
US$m
2006
at 2007
exchange
rates
US$m
Acquisitions,
disposals
and dilution
gains2
US$m
Underlying
change
US$m
2007
as
reported
US$m
Reported
change
%
Underlying
change
%
Net interest income .......... 4,197 261 4,458 375 743 5,576 33 17
Net fee income ................. 1,630 86 1,716 86 351 2,153 32 20
Other income3 .................. 1,008 60 1,068 102 366 1,536 52 34
Net operating income4 ... 6,835 407 7,242 563 1,460 9,265 36 20
Loan impairment charges
and other credit risk
provisions .................... (938) (81) (1,019) (133) (545) (1,697) (81) (53)
Net operating income .... 5,897 326 6,223 430 915 7,568 28 15
Operating expenses .......... (4,166) (258) (4,424) (320) (658) (5,402) (30) (15)
Operating profit ............. 1,731 68 1,799 110 257 2,166 25 14
Income from associates ... 4 – 4 9 (1) 12 200 (25)
Profit before tax ............. 1,735 68 1,803 119 256 2,178 26 14
For footnotes, see page 130.
Review of business performance
HSBC’s operations in Latin America reported a
pre-tax profit of US$2.2 billion compared with
US$1.7 billion in 2006, representing an increase of
26 per cent. HSBC’s acquisitions of HSBC Bank
Panama and Banca Nazionale in 2006 strengthened
the existing business platform and geographical
representation, and 2007 has been a year of
integrating these operations into HSBC. On an
underlying basis, pre-tax profits rose by 14 per cent
as increased revenues were partly offset by higher
loan impairment charges, largely from Mexico, and
increased operating costs across the region.
Both Mexico and Brazil made notable
contributions to Commercial Banking’s pre-tax
profits, which were 64 per cent higher than in 2006,